Stacey has been writing about SaaS and digital marketing for over 10 years and on other topics for much longer. Alongside this, she's fascinated with web design, user experience, SEO, and scaling small businesses.
Why Most Analytics Reports Are a Waste of Time
Posted on -
Written By:
Stacey Corrin
Contents
Most analytics reports aren’t very helpful because they show you data without telling you what to do with it. If you’ve ever opened a dashboard, scrolled through a wall of charts, and closed the tab feeling no clearer than before, I understand your frustration.
I’ve seen this pattern play out with small website owners more times than I can count. Someone spends an afternoon building a dashboard, checks it twice, and never opens it again. The report wasn’t built to help one person make one decision. It was built to look thorough.
In this article, I’ll break down why reports fail and what a reporting habit built around action looks like instead.
The Problem With Most Analytics Dashboards
Most reports overwhelm you with data that has no connection to what you’re trying to accomplish. That’s the core issue, and it’s baked into how most analytics dashboards are designed.
And the truth is, when everything looks the same, nothing stands out.
I’ve also noticed the people who struggle most with analytics aren’t the ones who lack data. They simply have too much of it, and no clear signal telling them what matters.
These reports are built for teams with dedicated analysts, not for a solo site owner fitting analytics between content updates and client work.
If reading a report doesn’t change what you do next, the time you spent on it was wasted.
Four Reasons Your Reports Aren’t Working
Analytics reports fail because it’s hard to trust the data, the audience is unclear, and nothing is built for action. Here’s how each one plays out:
Numbers don’t match reality, so you stop believing the report
One-size-fits-all dashboards
Default templates try to serve every role at once
No one sees what they need, so no one checks
Vanity metrics front and center
Pageviews and sessions look impressive but don’t connect to goals
You feel informed but don’t act
Report sprawl
New dashboards get created for every question, then abandoned
You don’t know which report to trust
Why You Stop Trusting Reports
When your GA4 sessions don’t match your hosting stats or your CRM shows different lead counts, you start second-guessing everything.
GA4 samples data on larger sites, so the numbers aren’t always exact. Ad blockers and consent banners widen the gap between real and reported traffic.
I’ve talked to site owners who stopped checking analytics entirely because of this, and honestly? I get it. Once you’ve seen the numbers not line up twice, you just stop checking.
Why Polished Dashboards Still Get Ignored
A clean analytics layout with branded colors still gets ignored if it doesn’t serve a purpose. Design doesn’t fix a missing goal.
From what I’ve seen, the dashboards that get abandoned fastest are the ones with the most charts. Every widget competes for attention, and nothing tells you where to look first.
The bigger issue is that most dashboards sit in a separate tab with no connection to your daily workflow. There’s no prompt, no schedule, and no next step. If checking a report feels like a chore you have to remember, it won’t survive the first busy week.
What a Useful Analytics Report Actually Does
A useful analytics report tells you what changed, why it matters, and what to do next.
You can’t get to that point though without picking a goal first. Without one, every metric feels equally important, and you end up tracking everything without acting on anything.
Most small sites have one primary goal at any given time: leads, sales, bookings, or email signups. Once you know yours, you only need 1 to 3 supporting metrics.
A Simple Reporting Workflow That Doesn’t Get Ignored
Reporting works when it’s short, consistent, and tied to one decision per cycle. The moment it takes more than 10 minutes, it starts getting skipped.
Here’s the workflow I recommend:
One schedule. Pick a day and time. Tuesday morning works well because you have a full week of data.
One owner. One person is responsible for checking the report and flagging changes.
One decision per cycle. Every check should end with one thing to change, test, or keep doing.
Weekly check, monthly review. The weekly check takes under 10 minutes. The monthly review is where you ask whether the goal itself still makes sense.
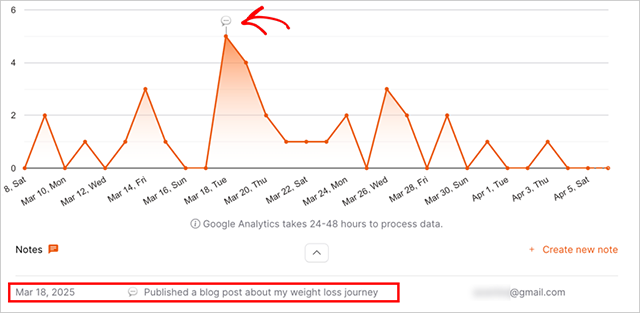
Notes on what changed. Write one sentence each week about what you noticed. After a month, you’ll have a record of what’s working.
I’ve found that the notes part is what makes this stick. Without them, every week feels like you’re starting from scratch. Even one sentence gives you something to compare against.
The hard part is doing it consistently, not doing it perfectly.
Of course, even a good workflow depends on you remembering to check. That’s one of the reasons I use OnePageGA.
How OnePageGA Keeps Reporting Short and Actionable
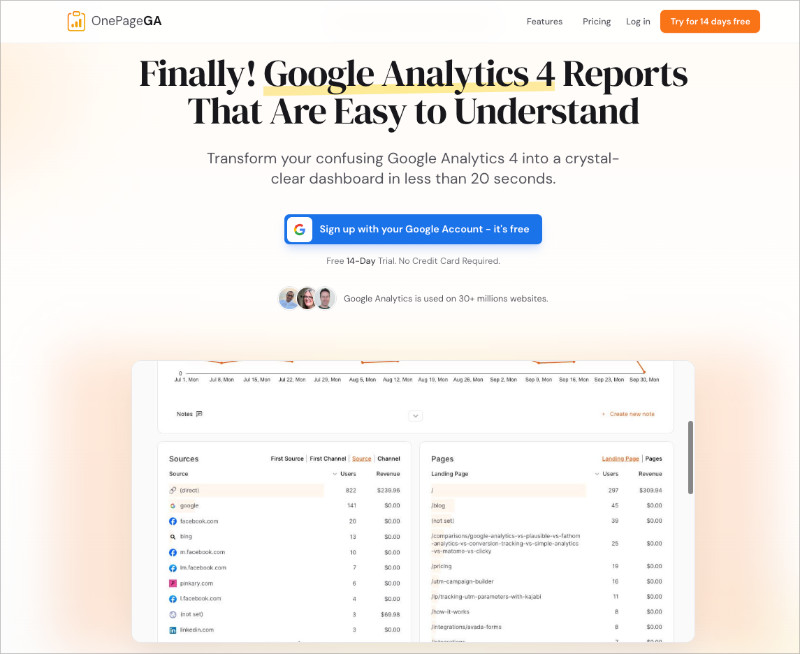
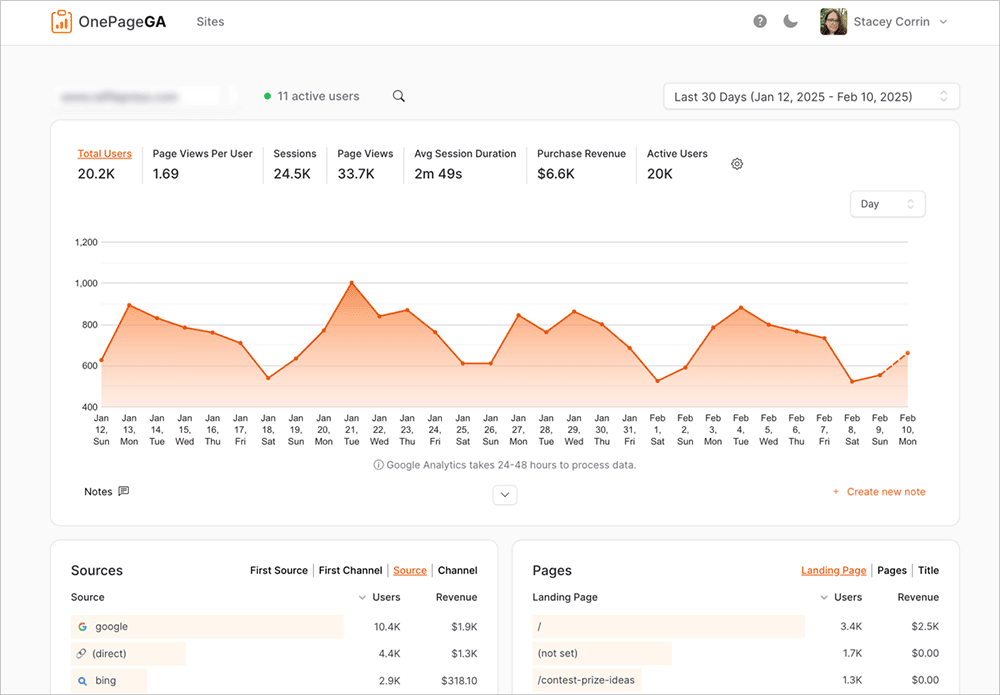
OnePageGA strips reporting down to what helps you decide, not what looks impressive. It’s a clean dashboard that pulls your Google Analytics data into a single, easy to understand page. The one-page layout forces every metric to earn its spot, so you’re not starting from a blank dashboard wondering which widgets to add.
I use OnePageGA because it fits the kind of workflow I described above. You open it, see what shifted, and decide what to do. There’s no exploration required, which is a game changer compared to GA4.
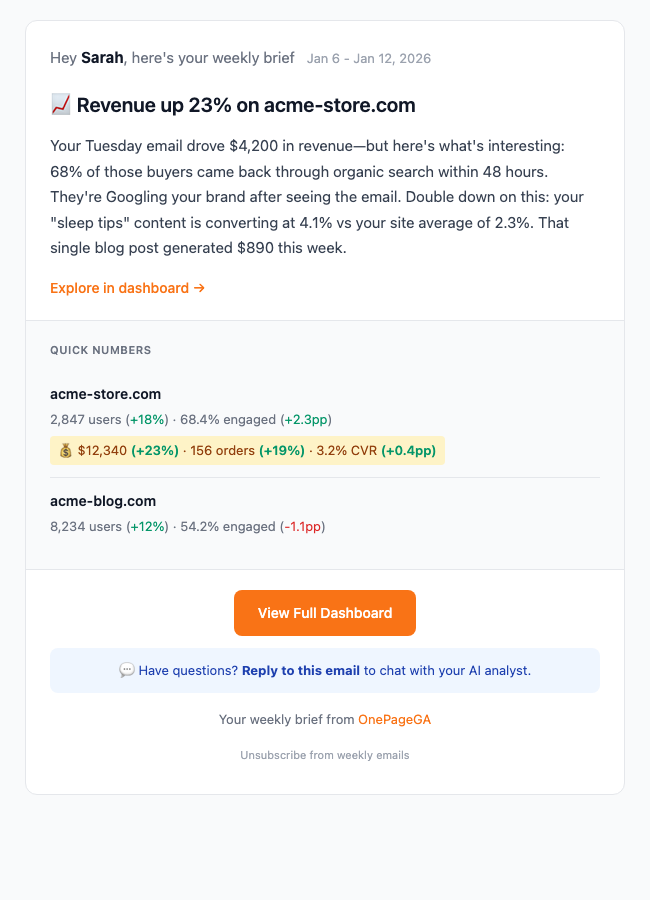
But the feature that changed my weekly routine the most is AI Weekly Insights. Every Monday morning, OnePageGA sends a personalized report to your inbox with week-over-week comparisons, top traffic sources, and a few sentences of AI-written analysis explaining what changed and what to do about it.
You don’t have to log in or remember to check anything. The report comes to you, in plain English.
If you run an ecommerce site, the email also includes revenue, orders, and conversion rate changes. And if something in the report raises a question, you can reply directly to the email and ask a follow-up. OnePageGA’s AI responds with context-aware answers based on your data.
That’s exactly the kind of reporting this whole article is about: short, focused, and built to help you act.
FAQs About Analytics Reports
Why do analytics reports show different numbers in different tools?
Tracking rules, attribution models, time zones, and data sampling can all change totals. GA4, your CRM, and your ad platforms each count visitors differently. Small gaps are normal, but large differences usually point to a misconfigured tag or missing filter.
How often should you check analytics if you are short on time?
A weekly quick check and a monthly review is enough for most small sites. The weekly check covers what changed. The monthly review covers whether your goal still makes sense.
Which GA4 reports are actually worth looking at?
Focus on acquisition, engagement, and conversions, each tied to one goal. Ignore the rest until you have a specific question that needs deeper data.
Do you need an analytics dashboard if you only run one website?
A single focused report is usually better. Dashboards are designed for teams managing multiple data streams. One site with one goal needs a simpler view.
Analytics reporting is a communication problem, not a data problem. Most reports fail because they were never designed to help you decide anything.
The good news is that fixing it doesn’t take much. Start with one goal, track a few numbers that show progress, and build a short weekly habit around it.
If your current analytics setup isn’t doing that, OnePageGA is a good place to start fresh.
You may also find the following analytics guides helpful:
Google Analytics alternatives are tools that replace or simplify Google Analytics tracking. And honestly, I started looking for one after spending 45 minutes trying to find a simple traffic breakdown in GA4.
45 minutes. For a metric that should take seconds.
GA4 is powerful. No one’s arguing that. But it’s built for data analysts, not website owners who need to know what’s working so they can make more money.
The complexity, the privacy concerns, the endless menu diving. That’s why I tested the best Google Analytics alternatives to find the ones that simplify reporting, respect privacy, and deliver insights you can actually act on.
Here’s how they stack up.
Comparison of Google Analytics Alternatives
#
Alternative
Best For
Free Plan
Starting Price
🥇
OnePageGA
Simplifying GA4 for website monetizers
Free trial
From $10/month
🥈
Matomo
Privacy + full data ownership
✅
Free (self-hosted)
🥉
Plausible
Lightweight privacy-first tracking
Free trial
From $9/month
4
Fathom Analytics
Premium simplicity and reliability
Free trial
From $15/month
5
Mixpanel
Product and user behavior analytics
✅
Free up to 1M events
6
Adobe Analytics
Enterprise-level insights
❌
From $100K/year
7
Piwik PRO
Healthcare/finance compliance
Free trial
Custom pricing
8
Simple Analytics
Ultra-minimalist cookieless
✅
From $15/month
How I Chose These Google Analytics Alternatives
I didn’t just read feature pages and compare pricing charts. I connected the same GA4 property to every platform on this list and used each one for actual work.
My goal? Find which tools make GA4 data easier to understand. And which ones just add another layer of complexity on top of it.
Here’s what I looked at:
Setup speed: How fast could I connect and start seeing usable data without troubleshooting?
Simplify vs. replace: Does it pull from existing GA4 data, or do I need to install new tracking code?
Clarity: Can someone who isn’t a data analyst look at the dashboard and get it right away?
Privacy features: Cookieless tracking, GDPR compliance, data ownership options.
Use case fit: Does it actually help website monetizers, agencies, and content creators?
Pricing and scalability: Is it fair for solo creators, small teams, and agencies managing a bunch of sites?
The tools that made this list all share the same foundation. Fast setup, clear insights, reports anyone can understand.
But they each solve different problems for different people. And that’s the whole point.
The Top Google Analytics Alternatives
I tested dozens of analytics platforms over the past few months. Most were forgettable. A few genuinely changed how I look at tracking.
These 8 stood out.
1. OnePageGA: Best for Simplifying GA4 Without Losing Your Data
OnePageGA is a lightweight analytics platform that turns complex GA4 data into one clear, visual report.
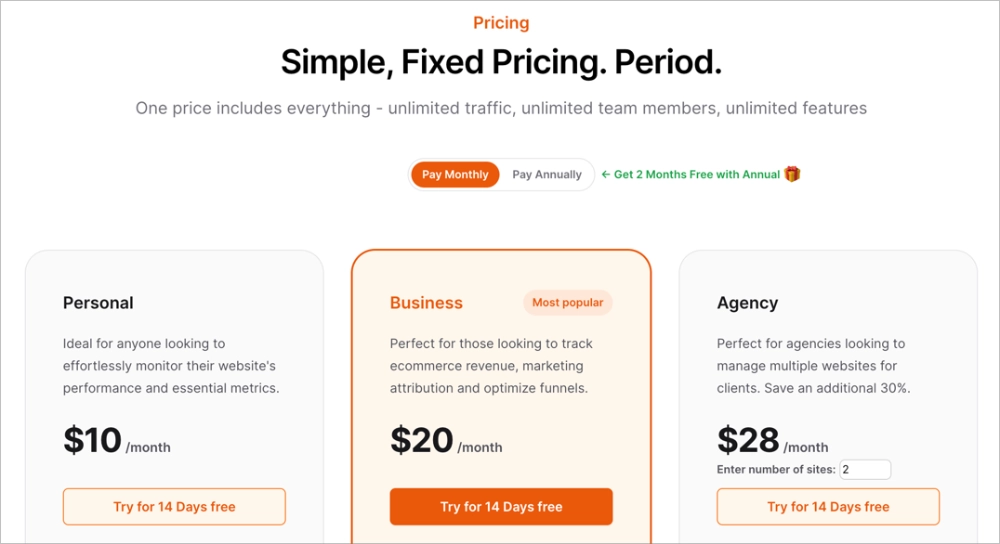
Pricing
Personal $10/mo, Business $20/mo, Agency $28/mo per site
Free Plan/Trial
14-day free trial (no credit card)
Standout Features
🔹 20-second setup with Google login 🔹 AI Weekly Insights emailed every Monday 🔹 Reply to emails to ask data questions
Rating
A+
Best For
Website owners who monetize and need insights fast
It’s the tool I now use every day. And I don’t say that lightly. It saves me hours of GA4 menu diving just to find basic metrics.
Setup took 20 seconds. I signed in with Google, picked my GA4 property, and had a complete dashboard waiting for me. I didn’t need to build, filter, or configure anything.
Here’s what really sets OnePageGA apart, though. In January 2026, they launched AI Weekly Insights. Every Monday morning, a personalized email lands in my inbox breaking down my traffic for the week. It spots trends I’d miss on my own and gives me one specific action to take.
And I can reply to that email with a question about my data. Just reply, ask, and get an instant AI answer back. I don’t even need to log in. It’s like having an analyst on call who never sleeps.
For website monetizers specifically, this is where OnePageGA earns its keep. Content creators, affiliate marketers, ecommerce owners, bloggers. You need to know what’s making money. Every minute in analytics is a minute you’re not creating content or optimizing conversions.
OnePageGA shows you your revenue drivers in seconds instead of hours. And if you’re running an agency, the $28/month per site plan makes client reporting ridiculously fast.
Pros
Cons
✅ Fastest setup (20 seconds)
❌ Limited customization for power users who want granular control
✅ AI Weekly Insights eliminate logging in
✅ Works WITH existing GA4 data (no migration)
✅ Perfect for website monetizers
In my experience, OnePageGA is the simplest way to turn GA4 data into insights you can actually use. Especially if you’re making money from your website.
2. Matomo: Best for Open-Source Analytics with Full Data Ownership
Matomo is the most established open-source Google Analytics alternative. It launched back in 2007 as Piwik, and over 1 million websites use it today.
Pricing
Free (self-hosted) or from $24/month (cloud)
Free Plan/Trial
Yes (self-hosted forever free)
Standout Features
🔹 100% data ownership 🔹 Self-hosted or cloud options 🔹 Heatmaps and session recordings
Rating
B+
Best For
Privacy-focused organizations with technical resources
Matomo is a go-to option if you want complete control over your data. The self-hosted version means your data never leaves your own infrastructure. For organizations with strict privacy requirements like healthcare, finance, or government, that’s a big deal.
The feature set rivals GA4 in a lot of ways:
Heatmaps
Session recordings
Form analytics
A/B testing
Goal tracking
It’s designed as a complete GA replacement, not a simplified version.
But here’s the reality. The complexity is similar to GA4 itself. The self-hosted version needs server management, PHP knowledge, and ongoing maintenance. The cloud version takes care of hosting, but the interface still has a steep learning curve. Layers of menus and custom reports that take real time to master.
If Matomo’s privacy features appeal to you but you’re worried about the complexity, that’s worth thinking about.
OnePageGA keeps your data in the Google ecosystem but eliminates the interface overwhelm entirely. For most website monetizers, the time you save matters more than running your own analytics server. That’s time you could spend creating content instead.
Pros
Cons
✅ Complete data ownership/privacy control
❌ Steep learning curve (similar to GA4)
✅ Most feature-rich GA alternative
❌ Self-hosted requires technical expertise
✅ Open-source with active community
❌ Cloud version expensive at high traffic
Ultimately, Matomo is best for organizations that need complete data ownership for compliance and have the technical resources to back it up.
3. Plausible: Best for Lightweight Privacy-First Analytics
Plausible is a lightweight, privacy-focused analytics platform that gives you the essentials without slowing down your site.
Pricing
From $9/month (scales with traffic)
Free Plan/Trial
30-day free trial
Standout Features
🔹 Cookieless tracking 🔹 < 1 KB script (45x lighter than GA) 🔹 GDPR compliant by default
Rating
A-
Best For
Privacy-conscious site owners who want simplicity
Setup couldn’t be simpler. Add the tracking script, and data starts flowing within minutes. The dashboard follows a one-page design, showing everything at a glance:
Real-time updates, with no data sampling, unlike GA4.
And the script weighs under 1 KB. GA4’s is 75 KB. That’s 75x lighter. Your site won’t even notice it’s there.
The privacy focus is genuine. Cookieless tracking means no cookie consent banners cluttering up your site. No personal data collection. GDPR and CCPA compliant by default. The code is open-source, so anyone can verify what it does. And it’s hosted in the EU for data residency.
Privacy isn’t bolted on here. It’s baked into the architecture.
The tradeoff? Basic web analytics only. No advanced segmentation or user-level tracking.
Plausible works brilliantly if you want to leave Google entirely. But there are real limitations to think about:
No Google Search Console integration (you lose SEO insights)
No access to your GA4 historical data
No Google Ads conversion tracking
If you still rely on any of that, OnePageGA lets you keep the full Google ecosystem while simplifying the interface on top of it.
Pros
Cons
✅ Extremely fast loading, won’t slow your site
❌ Limited features vs GA4
✅ Privacy-first by design (no cookie banners)
❌ No user-level tracking or advanced segments
✅ Clean simple interface
❌ Lose historical data if you cancel subscription
If privacy is your top priority and you want a simple, ethical analytics tool, Plausible is a strong pick.
Fathom Analytics targets businesses willing to pay a premium for the perfect balance of simplicity and sophistication.
Pricing
From $15/month (scales with pageviews)
Free Plan/Trial
7-day free trial
Standout Features
🔹 Forever data retention 🔹 Email reports 🔹 EU hosting options
Rating
A-
Best For
Businesses prioritizing data accuracy and reliability
Fathom positions itself as the quality-over-price option, and it was founded by developers who were frustrated with with analytics practices. That frustration shows in the best way possible. The whole product is built around simplicity without sacrificing the stuff that actually matters.
Setup was flawless and took under 10 minutes with clear instructions. Everything about the experience felt intentional.
What impressed me most was the polish across the board. Goal tracking is intuitive with no complicated configuration, email reports arrive on schedule with clean formatting, and you get forever data retention.
That last one is a big differentiator because Plausible’s data disappears if you cancel. Fathom keeps it.
You can also import historical GA data if you’re switching and don’t want to lose continuity, which is a nice touch. They back it all with a 30-day money-back guarantee.
The pricing model scales with traffic though, and that’s where it gets tricky:
$15/month at the starter level
$45/month for 500K visitors
That adds up fast as your site grows.
OnePageGA offers similar dashboard simplicity at $10-28/month regardless of traffic volume. It also keeps your GA4 data intact so you don’t lose the Google ecosystem. For growing sites, that’s a better value.
Pros
Cons
✅ Polished interface and professional presentation
❌ Premium pricing adds up for high-traffic sites
✅ Forever data retention included
❌ Basic features compared to GA4’s depth
✅ Excellent uptime and reliability
❌ No user-level tracking or advanced segments
If you’re an established business that values reliability and you’re willing to pay a premium for simplicity, Fathom delivers.
🔹 Event-based tracking 🔹 User segmentation and cohorts 🔹 Funnel and retention analysis
Rating
B+
Best For
SaaS companies and mobile app developers
Mixpanel operates in a different category than everything else on this list. It doesn’t track pageviews or traffic sources. It tracks what people actually do inside your product. Button clicks, feature usage, user flows through an app.
It’s built for SaaS companies, and the setup reflects that. You need to plan which events to track ahead of time, and the technical implementation is more involved than standard web analytics.
The platform shines when product teams need granular behavioral data. You can:
Segment users by demographics, behavior, or custom attributes
Compare cohorts over time
Build funnel reports showing where people abandon signup or checkout
Run retention analysis to find which features drive long-term engagement
A/B test within your product
The free plan is generous at 1M events per month, which covers most startups comfortably. But pricing gets complex at scale and the learning curve is steeper than typical web analytics.
Here’s the key distinction though. Mixpanel answers “which app features drive retention?” OnePageGA answers “which content drives revenue?” They’re solving different problems for different businesses.
Use Mixpanel if you’re building a SaaS product or mobile app. Use OnePageGA if you’re monetizing a website through content, ads, affiliate, or ecommerce. Faster setup, clearer insights, and built specifically for that use case.
Pros
Cons
✅ Powerful product and user behavior insights
❌ Requires technical setup and event planning
✅ Generous free plan for startups
❌ Different use case than web analytics
✅ Great for SaaS and mobile apps
❌ Pricing gets expensive at scale
Ultimately, Mixpanel is ideal for SaaS companies and app developers who need to understand user behavior at a granular level.
Adobe Analytics is an enterprise analytics platform that provides comprehensive customer journey analysis with unlimited customization.
Pricing
From $100K+/year (custom enterprise)
Free Plan/Trial
No (custom demos available)
Standout Features
🔹 Unsampled data processing 🔹 Advanced segmentation 🔹 Cross-channel attribution
Rating
B (for cost/complexity)
Best For
Large enterprises with dedicated analyst teams
Adobe Analytics operates at enterprise scale. It’s built for Fortune 500 companies tracking complex customer journeys across multiple channels, and the pricing reflects that. Annual costs typically land between $100K and $350K+.
The capabilities are unmatched. Unsampled data processing regardless of volume, unlimited customization, advanced cross-channel attribution, and tight integration with the rest of the Adobe Experience Cloud suite.
But accessing all that power requires a massive investment beyond just the license fee:
Implementation takes 3-6 months with consultants
Total first-year costs often hit $200K-500K (licensing + implementation + training)
You need dedicated analysts who understand the interface and terminology
The learning curve is steep even for experienced marketers
Vendor lock-in makes migration difficult once you’re committed
Unless you’re managing a Fortune 500 company, Adobe’s capabilities exceed what most businesses actually need. The core benefit everyone wants is the same: instant insights without menu diving.
OnePageGA delivers exactly that for $10-99/month with a 20-second setup. No 6-month implementation, no dedicated analysts required. You get dashboard clarity and actionable recommendations without the enterprise price tag.
All things considered, Adobe Analytics only makes sense for large enterprises with complex needs and the budgets to match.
7. Piwik PRO: Best for Compliance-Focused Organizations
Piwik PRO is designed for organizations in regulated industries that need strict compliance with privacy regulations.
Pricing
Custom (contact for quote)
Free Plan/Trial
30-day free trial
Standout Features
🔹 GDPR/HIPAA compliant 🔹 EU data residency 🔹 On-premise hosting option
Rating
B
Best For
Healthcare, finance, government organizations
Built specifically for healthcare providers, financial institutions, and government agencies, Piwik PRO is a fork of Matomo (the original Piwik) with an enterprise compliance focus.
Privacy and security are engineered into the foundation, with GDPR, HIPAA, and PIPEDA compliance baked in. You also get EU data residency options and on-premise hosting for complete control.
Organizations with the strictest data requirements trust it for good reason.
The interface feels dated compared to modern alternatives though. The learning curve is steep for non-technical users, and the free plan is extremely limited. It’s essentially a trial version.
Custom pricing typically lands in the expensive range, and for most businesses, it’s overkill. You’d be paying for compliance features you don’t legally need.
It makes sense only if compliance is legally required. Otherwise, there are simpler and cheaper options on this list.
Pros
Cons
✅ Built specifically for compliance requirements
❌ Interface confusing for non-technical users
✅ Strong data security and privacy controls
❌ Limited free plan with expensive custom pricing
✅ Trusted by regulated industries
❌ Overkill unless compliance is main concern
Piwik PRO is the right choice if you operate in a regulated industry and compliance is non-negotiable.
Simple Analytics lives up to its name by providing the most streamlined analytics experience possible.
Pricing
From $15/month
Free Plan/Trial
Free up to 1 month history
Standout Features
🔹 Cookieless tracking 🔹 Ultra-minimalist interface 🔹 API access
Rating
B
Best For
Minimalists who want almost nothing
True to its name, this is the most stripped-down option on the list. It shows visitor counts, pageviews, and referrers. That’s about it.
The features are intentionally limited, it’s cookieless and GDPR compliant, and the interface loads instantly. There’s essentially nothing to configure or customize, which appeals to people who feel overwhelmed by data.
The appeal is niche though. The target audience is personal bloggers and side project owners who find even Plausible overwhelming. And the value proposition gets questionable when you look at pricing.
Simple Analytics starts at $15/month. Plausible starts at $9/month with more features. You’re paying more for less.
If you’re running a business and need to grow or optimize, this probably isn’t for you.
Pros
Cons
✅ Extremely simple (impossible to get confused)
❌ Too limited for most business needs
✅ Privacy-first (no cookies)
❌ Higher starting price than Plausible ($19 vs $9)
✅ Clean minimalist interface
❌ Missing features most marketers need
Simple Analytics is best for minimalists who genuinely want as little data as possible.
Which Google Analytics Alternative Is Best?
After testing all 8 tools, OnePageGA stood out as the best overall. It delivers what most people actually need: fast setup, clear reports, and actionable insights without any of the GA4 complexity.
Other tools have their place:
Matomo for data ownership
Mixpanel for SaaS product analytics
Plausible or Fathom if you want to leave Google entirely
But for content creators, affiliate marketers, e-commerce owners, and agencies who monetize websites, OnePageGA is the clear winner. It works with your existing GA4 data, sets up in 20 seconds, and delivers AI-powered insights to your inbox every Monday. You don’t even need to log in.
All the power of Google’s data with the simplicity of a one-page dashboard. $10-8/month per site, whether you’re managing one site or dozens.
FAQs About Google Analytics Alternatives
Why use an alternative instead of GA4 directly?
GA4 is powerful but not user-friendly. Alternatives save time by highlighting the metrics that matter without forcing you to dig through menus.
For website monetizers who need to quickly understand what’s driving revenue, that time savings is huge. OnePageGA turns hours of GA4 navigation into seconds. Some users also choose alternatives for privacy compliance or to avoid Google’s data practices entirely.
Which Google Analytics alternatives are free?
Matomo is completely free if you self-host on your own server. Mixpanel has a generous free plan at 1M events per month, which is perfect for startups. Plausible and OnePageGA both offer free trials (30 days and 14 days).
In reality, most feature-rich alternatives charge $10-50/month for full functionality. Still far less than enterprise tools like Adobe Analytics at six figures annually.
What’s the best Google Analytics alternative for agencies?
OnePageGA. The Agency plan runs $28/month per site and lets you manage multiple client dashboards from one account. Clients with GA4 access can see reports instantly without any additional setup. AI Weekly Insights also eliminates manual report creation since clients get automated insights every Monday. If you need more customization and white-label reporting, DashThis is worth a look too.
What’s the best alternative for website monetizers?
OnePageGA was specifically built for this. Content creators, affiliate marketers, ecommerce owners, bloggers making money from their sites. AI Weekly Insights tells you what changed in your traffic and what action to take, so you can spend time optimizing revenue instead of analyzing data. The Personal plan is $10/month for solo creators and the Business plan is $20/month with ecommerce revenue tracking.
Do privacy-focused alternatives affect my SEO?
No direct SEO ranking impact from your analytics choice. There are potential indirect benefits though. Lighter scripts improve page load speed, which is a confirmed ranking factor. Plausible’s script is under 1 KB compared to GA4’s 75 KB. One thing to consider: if you rely on Google Search Console data for SEO insights, tools that work with GA4 (like OnePageGA) keep that integration. Complete replacements like Plausible don’t.
Can I use Google Analytics and an alternative together?
Yes, and many people do. OnePageGA is specifically designed to work alongside GA4. It pulls your existing GA4 data and displays it in a simple dashboard, so you keep all of Google’s tracking and historical data while getting instant clarity. Other alternatives like Plausible and Matomo require running separate tracking code alongside GA4, which can slightly impact page load times.
How do I migrate from Google Analytics?
It depends on which alternative you choose. With OnePageGA there’s no migration at all. You connect to your GA4 account in 20 seconds and start viewing simplified reports immediately. Complete replacements like Plausible and Matomo require adding their tracking code to your site. Most alternatives can’t import historical data, so it’s worth keeping GA4 active for historical reference while using your new tool going forward.
What’s the difference between web analytics and product analytics?
Web analytics tools like OnePageGA, Plausible, and Matomo track website performance. Traffic sources, page views, conversions, content performance. They answer questions like “where are visitors coming from?” and “which pages drive sales?”
Product analytics tools like Mixpanel track user behavior within apps and software. Button clicks, feature usage, user flows. They answer “which features do power users engage with?” and “where do users drop off in onboarding?” Most website owners need web analytics. SaaS companies need product analytics.
If you’re tired of wasting time trying to make sense of GA4, the right alternative can change everything. Your analytics tool should make data simple, clear, and ready to act on. Not something you avoid using.
After testing them all, OnePageGA is the tool I keep coming back to. It gives me instant clarity without the clutter, delivers AI-powered insights to my inbox automatically, and lets me reply with questions when I need more context. All the power of GA4’s data with none of the confusion.
How to Track Leads in Google Analytics (Quick and Simple Guide)
Posted on -
Written By:
Stacey Corrin
Contents
Google Analytics lead tracking is the process of recording when real people take meaningful actions on your website, such as submitting a form or requesting a quote.
If you’ve ever looked at your dashboard and felt a pang of anxiety because your lead numbers don’t match your actual email inbox, you aren’t alone. It’s frustrating to see conflicting data, especially when you need to report ROI to a client or your boss.
In this guide, I’ll show you exactly how to track real leads, explain why the numbers sometimes drift, and give you a simple way to view your results without the headache.
What Counts as a Lead in Google Analytics (GA4)
In GA4, a lead is simply a standard event that you mark as a “Key Event.” This tells Google that the action is important to your business.
However, not every interaction should count as a lead. A simple newsletter signup is very different from a high-value quote request.
To distinguish between the two, GA4 uses a specific tag called generate_lead.
Using this specific event name helps you separate casual browsers from serious prospects. It ensures you are tracking actual business intent rather than just website activity.
Why Your Lead Numbers Don’t Always Match
Lead numbers often differ between GA4 and ad platforms because they assign credit differently. This is usually an attribution issue, not a broken tracking setup.
Ad platforms often count “view-through” conversions where a user sees an ad but never clicks it. Google Analytics only tracks the actual visit to your site.
You may also see leads listed as “Unassigned” in your reports. This usually happens when UTM tags are missing or broken.
To fix this, use a URL builder to format your campaign links correctly.
Finally, user privacy tools can sometimes strip data as people switch between apps. GA4 tracks the lead, but it might not know exactly where it came from.
How to Set Up GA4 Lead Tracking
You don’t need a developer degree to get this working, but you do need to pick the right strategy for your site.
There are essentially two ways to catch these leads: using a specific “Thank You” page or tracking the button click itself.
Method 1: Track Leads With a Thank You Page
If your form redirects to a confirmation page, this is the easiest way to track leads. You do not need complex code to tell GA4 that a specific URL equals success.
This method is highly reliable. It confirms that a user actually submitted the form rather than just clicking a button by mistake.
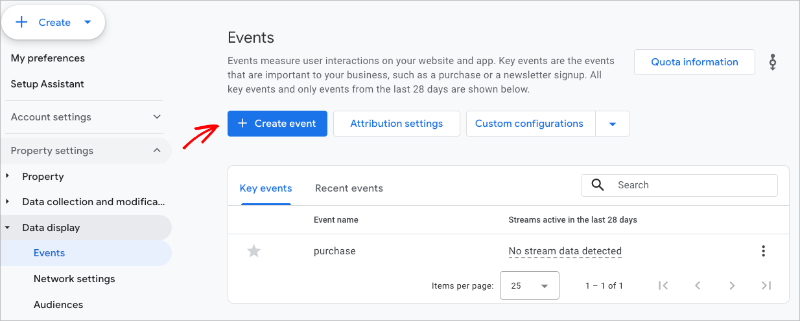
Here is how to set this up in GA4:
Go to Admin: Click on Events under the Data Display menu.
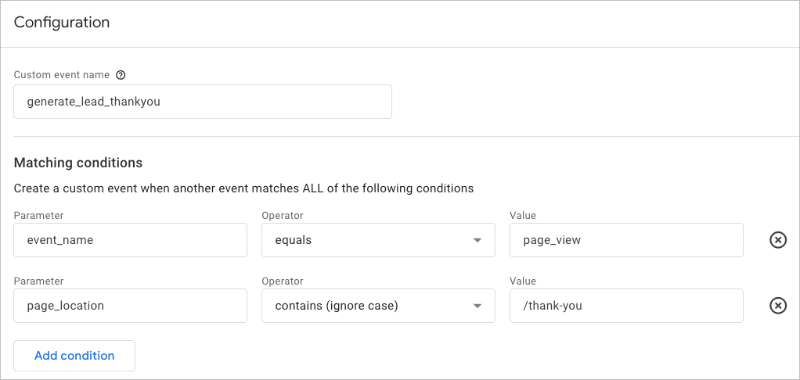
Create Event: Click Create Event and name it generate_lead_thankyou.
Set the Rules: Set the first condition so event_name equals page_view.
Add the URL: Click “Add Condition” and set page_location contains /thank-you.
Mark as Key Event: Save the event. Go to the Key Events tab and toggle it to “On”.
For popups, embedded forms, or AJAX submissions, you need to track the action itself. Not every form sends users to a new page, especially modern ones that just show a “Success!” message inline.
In these cases, you can’t rely on a URL change. Instead, you need to “listen” for the form submission event that happens in the background.
The most reliable method is using a form builder that often handles this automatically. If you are not using a form builder, you have to do this manually.
You will need to use the “Enhanced Measurement” feature or Google Tag Manager to track form submissions.
Here is the simplified workflow for capturing these events:
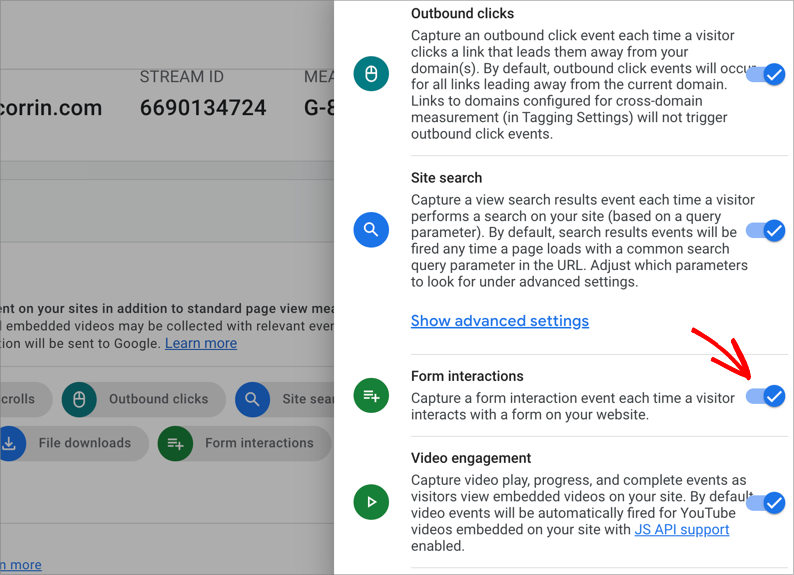
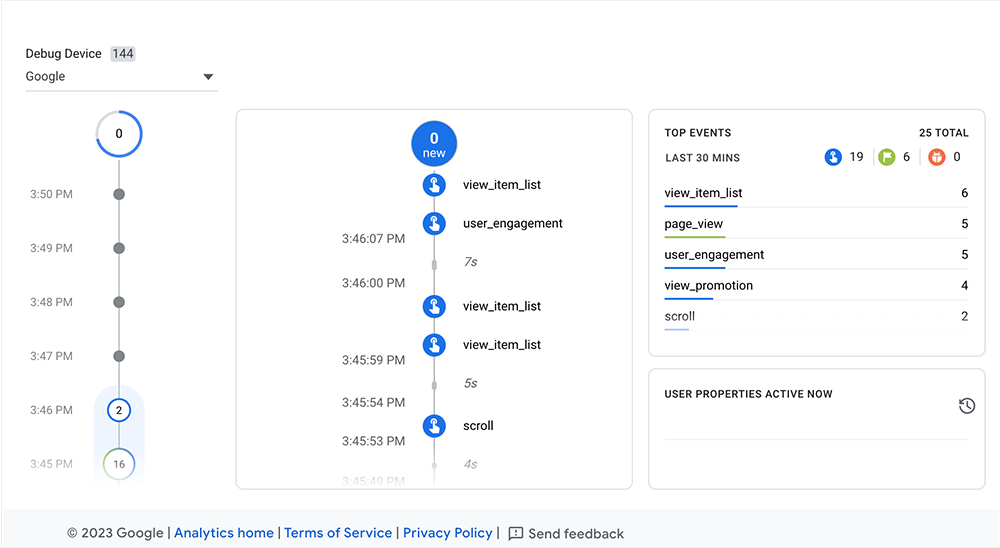
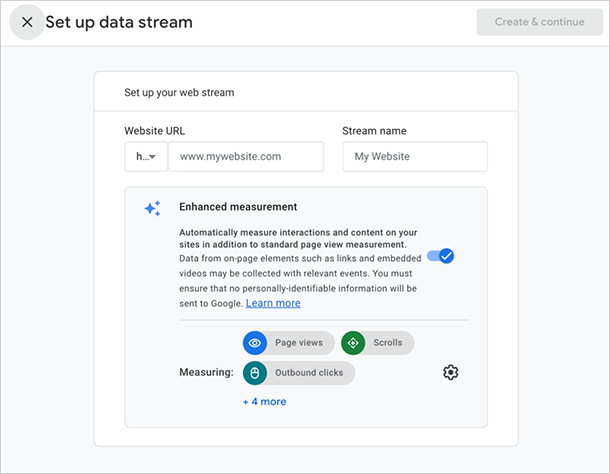
Enable Enhanced Measurement: Go to Admin » Data Streams and click on your web stream. Make sure the toggle for “Form interactions” is turned on.
Check the DebugView: Open your website in a new tab and submit a test form. In GA4, go to Admin » DebugView to see if an event named form_submit appears.
Create the Key Event: If form_submit is firing, go back to Events » Create Event.
Refine the Trigger: Create a new event named generate_lead where event_name equals form_submit AND page_location equals the page your form is on.
Save and Verify: Mark this new event as a Key Event just like in Method 1.
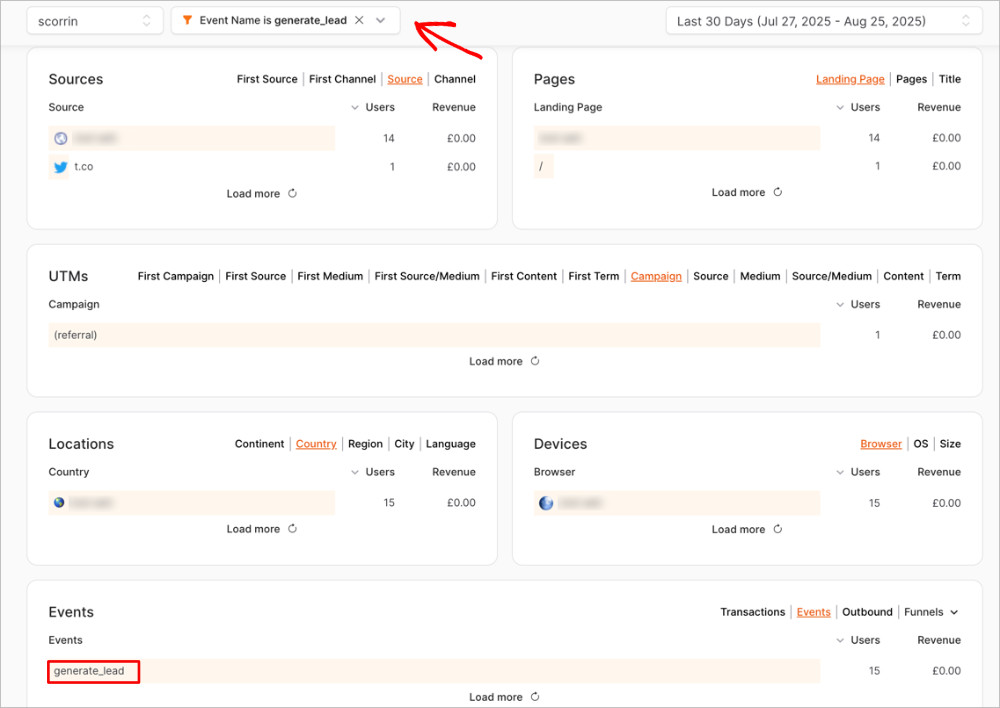
Collecting lead data is only half the job; you also need a practical way to view and understand it. If you can’t find the numbers quickly, you likely won’t use them to make better decisions.
To see your new data, follow these simple steps:
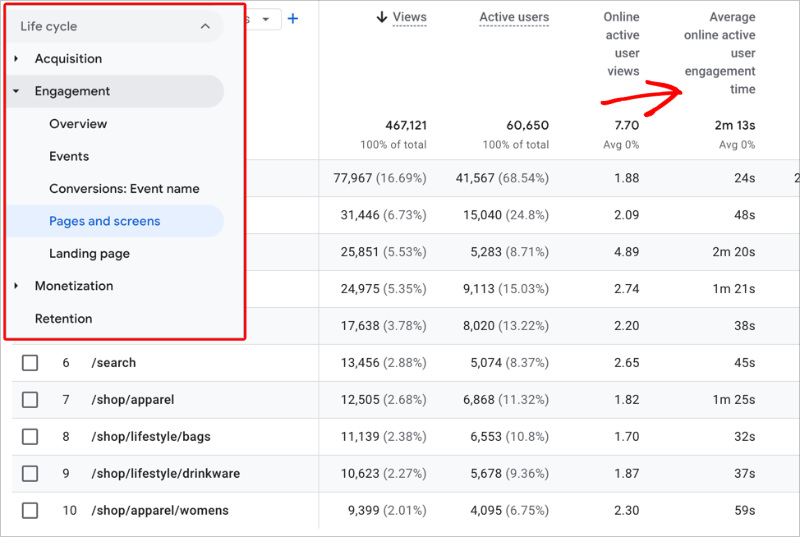
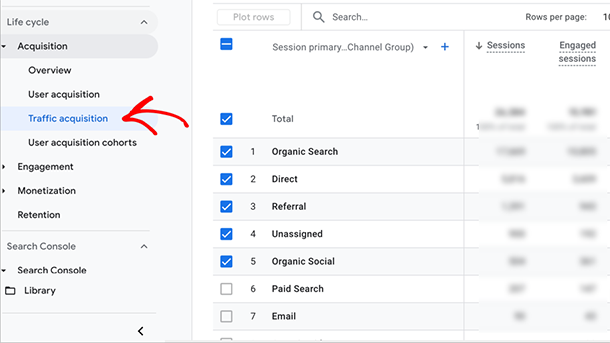
Open the Report: Go to Reports » Acquisition » Traffic Acquisition in the left-hand menu.
Find the Column: Scroll to the right of the table until you see the “Key Events” column.
Select Your Event: Click the dropdown arrow in that column header to select your new generate_lead event.
While these standard reports work, they are often cluttered with metrics you simply don’t need. You could try building “Explorations,” but they are clunky to set up and difficult to share with clients.
A Simpler Way to View Lead Performance
This is exactly why we built OnePageGA—to strip away the noise and focus on what matters.
OnePageGA is a simple, single-page analytics dashboard that connects directly to your Google Analytics account.
Instead of digging through five layers of menus, OnePageGA pulls your specific lead metrics onto a single screen so you don’t have to hunt for them.
It creates simple Google Analytics reports that show you exactly how many leads you got and where they came from in seconds.
It answers the only question your clients really care about: “How many leads did we get today?” without the headache of complex data tables.
Bonus: How to Get More Leads to Track
Now that your scoreboard is working, you need to put some points on the board. Tracking a conversion rate of 0% isn’t very exciting, so here are three quick ways to increase your lead volume immediately.
1. Reduce the Friction
Every extra field you ask for is a hurdle your user has to jump over. If you don’t absolutely need their phone number or job title, cut it.
Studies consistently show that removing just one form field can increase conversion rates by up to 26%. Keep it to name and email whenever possible to get the conversation started.
2. Add Trust Signals Near the Button
Anxiety kills conversions. When a user hovers over that “Submit” button, they are wondering if you’re going to spam them.
Place a small line of text below the button like “No spam, unsubscribe anytime” or add a trusted logo right next to the form. These micro-assurances reduce hesitation.
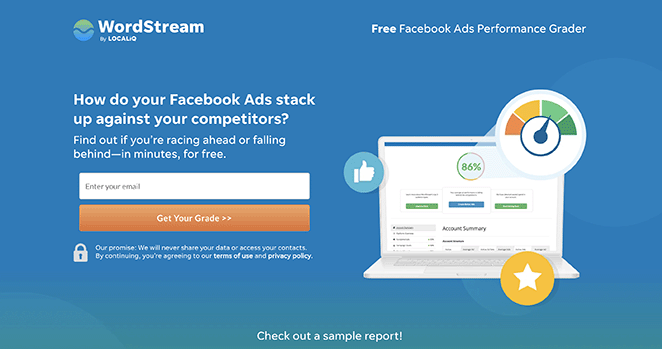
3. Use Dedicated Landing Pages
Sending paid traffic to your homepage is usually a waste of money. Homepages have too many distractions and menu links.
Instead, send traffic to a dedicated landing page that has one job: getting that lead. By removing the navigation menu and focusing the copy on a single offer, you’ll see your generate_lead events in GA4 skyrocket.
FAQs About Google Analytics Lead Tracking
Why doesn’t my GA4 lead count match my ad platform?
Ad platforms are generous with credit. They often count a lead if someone saw your ad, didn’t click, but converted later (view-through).
GA4 is stricter with its attribution. It usually only counts the lead if the user actually clicked through to your site during the session.
Can I see lead names or email addresses in Google Analytics?
No, absolutely not. Google has a strict policy against collecting Personally Identifiable Information (PII).
If you try to pass email addresses or names into GA4, they might suspend your account. Always keep personal data in your CRM, not your analytics tool.
What’s the difference between form_submit and generate_lead?
form_submit is a technical event that simply says “a form button was clicked.” generate_lead is a specific Google event that signals “a business goal was met.”
You should map the technical form_submit event to generate_lead. This helps GA4 understand that this specific action has real monetary value to you.
How long does GA4 attribution last?
For Key Events (conversions), GA4 uses a lookback window of up to 90 days. This is great for businesses with longer sales cycles.
This means if someone clicks an ad today but comes back directly to convert two months later, GA4 can still credit that original ad click.
Once your lead tracking is set up correctly, clear reporting is what makes the data actually useful. You shouldn’t have to fight your analytics tool just to answer a simple question about your business growth.
By using a simple setup and an easy-to-read dashboard, you can finally start trusting your numbers again. If you’re tired of digging through complex menus, give OnePageGA a look to turn that data into instant clarity.
How to Set Up Google Analytics Click Tracking The Easy Way
Posted on -
Written By:
Stacey Corrin
Contents
TL;DR: Use GA4 Enhanced Measurement for outbound links. For internal buttons, use Google Tag Manager (GTM) to create a generic Click Trigger and a GA4 Event Tag. Verify setup using GTM Preview Mode and GA4 DebugView.
You just launched a new ‘Get Started’ button, but do you know if anyone is actually clicking it? Mastering Google Analytics click tracking is the only way to answer that question with data, not guesses.
Back in the Universal Analytics days, checking clicks was simple. Now, in GA4, it feels a bit like a scavenger hunt because Google treats everything as an “Event.” It’s confusing if you aren’t used to the new interface.
I’m here to help make sense of the noise. In this guide, I’ll break down the process, showing you how to verify what’s tracked automatically and how to set up manual tracking for your money-making buttons.
How Does Google Analytics Click Tracking Work?
At its core, GA4 is completely different from the old version you’re used to; it treats every single click as a standalone “Event” rather than just a hit within a session.
Universal Analytics (Guest Book)
GA4 (Security Camera)
Tracks who showed up and how long they stayed.
Tracks specific actions individually (video plays, clicks).
This gives you granular data, but it also means you have to be precise about how you ask for it. Understanding this “event-based” model is the first step to mastering your data.
How to Track Outbound Clicks and Downloads in GA4
GA4 automatically tracks clicks to other websites and file downloads if “Enhanced Measurement” is on.
Enhanced Measurement is usually on by default. To make sure yours is working, go to Admin » Data Streams from your Google Analytics account and ensure the switch is flipped to blue.
This feature is a lifesaver. It specifically catches “click” events (links leaving your site) and “file_download” events (PDFs or docs) without you lifting a finger.
According to Forrester, for every $1 invested in UX (and tracking it), businesses see a return of $100. You need to know if users are actually engaging with your resources to get that ROI.
Even though GA4 tracks these automatically, finding the report requires digging through the “Engagement” menu. This is where OnePageGA helps. It’s the simplest Google Analytics dashboard that creates understandable reports in seconds.
While understanding GA4 events is important, OnePageGA bypasses the confusion by pulling these specific stats to the surface instantly, so you can see your outbound clicks at a glance.
How to Track Specific Buttons in GA4 Manually
To track a button that links to another page on your own site (like your pricing page), you can’t just use the default GA4 settings. GA4 does not automatically track internal link clicks as events.
To fix this, we need to use a free tool called Google Tag Manager (GTM). It acts as a bridge, telling GA4 exactly when a specific click happens.
If you have GTM installed, here is the simple 3-step process to track your pricing button.
Step 1: Create a Trigger
In Google Tag Manager, go to Triggers and click New. This tells the system when to fire the tag. Use these settings:
Configuration Setting
Value
Trigger Type
Click – Just Links
Fire On
Some Link Clicks
Condition
Click URL contains /pricing
Step 2: Create the Tag
Now go to Tags and click New. This tells the system what data to send to Analytics. Configure it as follows:
Configuration Setting
Value
Tag Type
Google Analytics: GA4 Event
Event Name
pricing_click
Trigger
Select the trigger created in Step 1
Step 3: Publish
Click the blue Save button in the top right corner. Once you publish the container, your tracking is live.
Where to Actually Find Your GA4 Click Tracking Data?
Don’t panic if you see zeros immediately after setting up click tracking. Historical data takes 24 to 48 hours to populate in the main reports.
Because of this processing delay, you actually need to use two different tools within GA4 depending on your goal. You need one tool to verify your setup works right now, and a different report to analyze your traffic trends later.
How to Test Your Buttons Instantly
Before you trust the data, you need to verify it. Since we used Google Tag Manager, click the Preview button in your GTM workspace first.
This opens your site in a debug mode. Click your pricing button, and you should see the “Tag Fired” message in the GTM window.
To double-check that GA4 received the signal, go to Admin » DebugView in your Analytics account. You should see the pricing_click event appear on the timeline.
Where to See Total Clicks
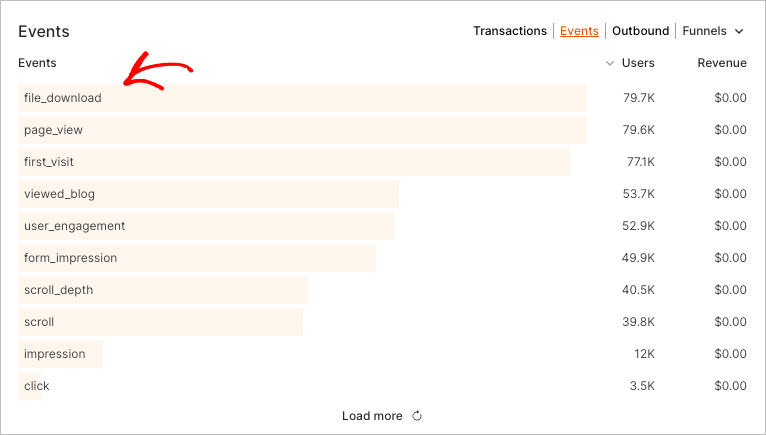
Once the data processes (usually the next day), you can find the aggregate numbers in the standard reports.
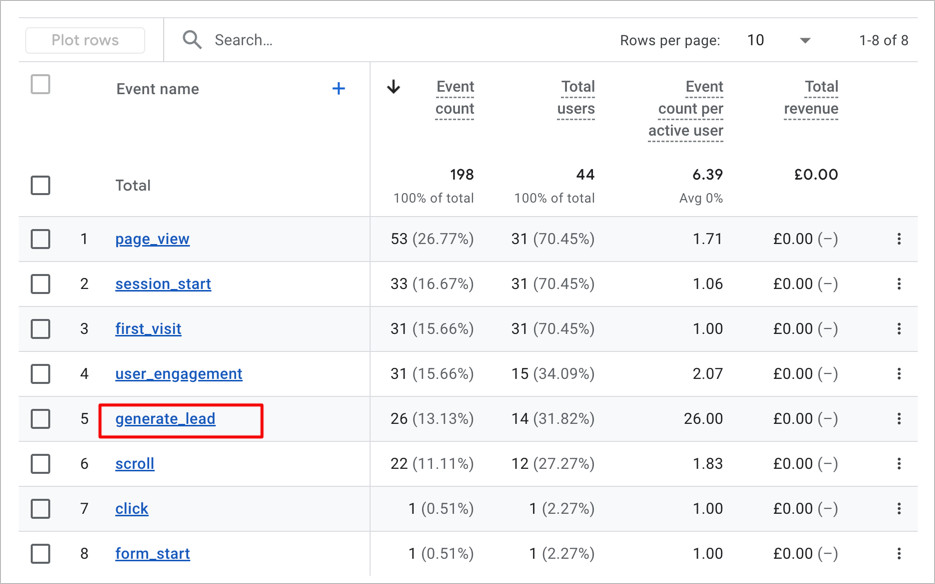
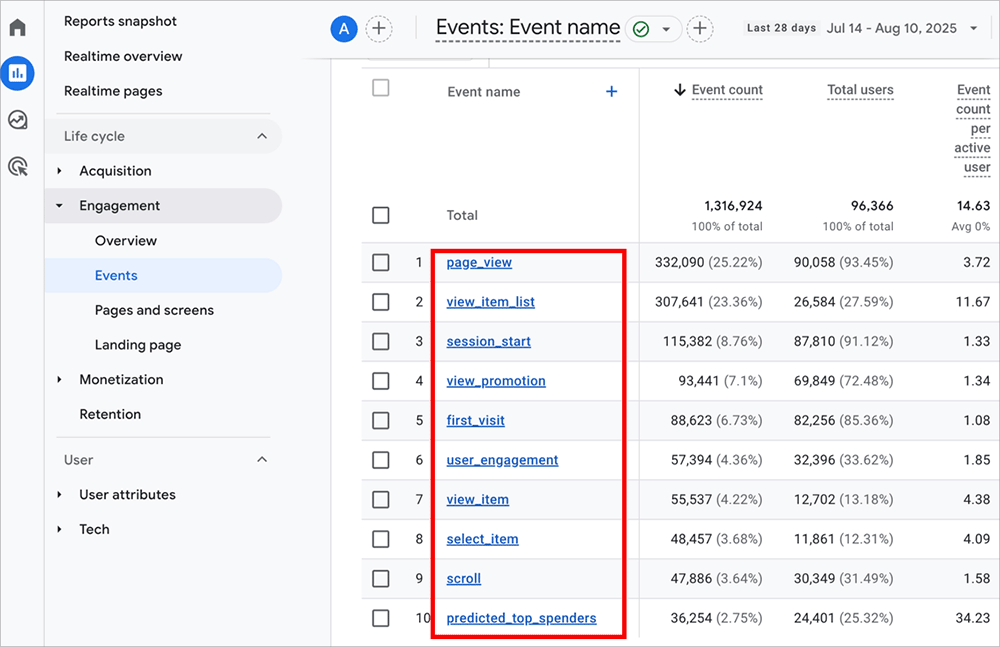
Go to Reports » Engagement » Events.
Scroll down to the main table.
You’ll see a list of every event, including click, file_download, and your custom pricing_click.
While Google Tag Manager does the heavy lifting of collecting the data, it doesn’t help you read it. To see your results in GA4, you still have to dig through multiple menu layers every time.
This is where OnePageGA shines. It takes that raw data and pulls your top-performing events directly onto a single dashboard.
You get the data you need immediately upon logging in and scrolling down to the events section, without digging through the “Engagement” folders.
FAQs on Google Analytics Click Tracking
What types of clicks can I track in GA4?
You can track almost anything with a URL or a button ID. Out of the box, GA4 tracks outbound clicks (links to other sites) and file downloads. For everything else—like internal menu clicks, “Add to Cart” buttons, or slider arrows—you’ll need to set up a custom event.
Can Google Analytics track how often a link is clicked?
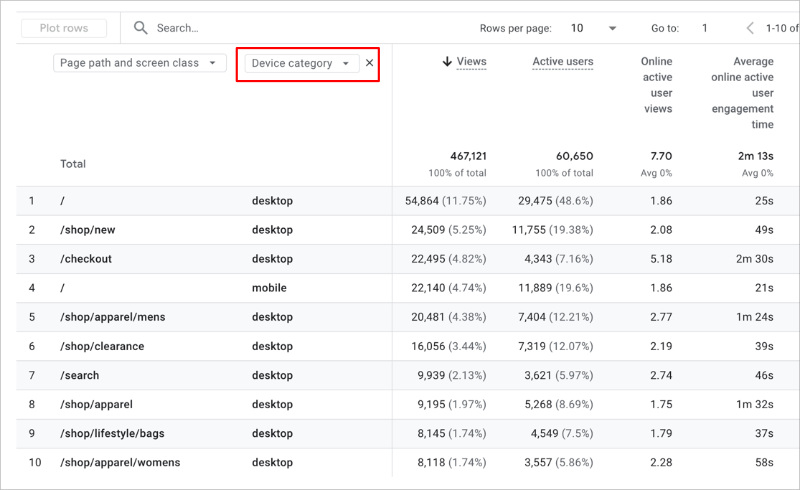
Yes, it counts every click as an “event count.” If you look at your “Pages and Screens” report, you generally see page views, but if you look at the “Events” report, you see the raw number of times people physically clicked the links you are tracking.
What’s the difference between internal and external link tracking?
The main difference is effort. GA4 tracks external links (leaving your domain) automatically via Enhanced Measurement. It does not track internal links (moving page-to-page on your site) automatically because it assumes page views cover that. You have to manually tag internal links if you want to measure specific button performance.
Can I track popup or form clicks in GA4?
Yes, but relying on button clicks is often messy. The “Form interactions” setting in GA4 often misfires.
The most reliable way to track forms is to redirect users to a “Thank You” page after they submit. Then, you can simply track views of that specific page URL.
Can I track clicks on sites I don’t own?
No, you can’t. To track a click, your Google Analytics tag ID must be installed on the website where the click happens. If you send traffic to Amazon or a third-party affiliate offer, you can track the click leaving your site, but you cannot see what they do once they land on the other URL.
Key Takeaways
Click tracking is essential for knowing why your site converts (or doesn’t). Without it, you’re essentially guessing which parts of your page are working.
Start with Enhanced Measurement: It’s free data that catches every outbound link and download automatically.
Use GTM for Specifics: For internal revenue buttons, use Google Tag Manager to create precise triggers.
Visualize the Data: Stop getting lost in the “Explore” tab. Use tools like OnePageGA to see your wins at a glance.
You may also find the following Google Analytics guides helpful:
What Is a Session in Google Analytics? (GA4 Beginner’s Guide)
Posted on -
Written By:
Stacey Corrin
Contents
A session in Google Analytics is a specific period of time when a user is actively interacting with your website or app. Think of it as a single “visit” where someone clicks, scrolls, or views pages before leaving or taking a long break.
If you’re coming from the old Universal Analytics (UA), you’ve probably noticed that session numbers in Google Analytics 4 (GA4) look a bit different. That’s because GA4 has a new way of counting these visits, and the change is throwing a lot of site owners off.
Don’t worry, though. I’m going to break down exactly how sessions work now, why the numbers changed, and which metrics actually matter for your business growth.
What Does a Session Mean in Google Analytics?
In simple terms, a session is a period of time when a user is active on your website.
Behind the scenes, GA4 tracks this using the session_start event. When a visitor lands on your page, GA4 checks if they have an active session ID. If they don’t, it fires the session_start event to begin a new one.
This distinction matters because session data shows you the volume of interaction on your site, not just how many individual people stopped by. But to read the numbers right, you need to know exactly when the timer starts and stops.
How GA4 Starts and Ends a Session
GA4 kicks off a session the instant a visitor arrives on your site and triggers that session_start event.
The system keeps the session alive as long as the user is doing something. However, if they stop interacting with your page for 30 minutes, GA4 closes the books on that specific session. If they come back and click something after that break, a brand new session begins.
Here’s a simple example: If someone visits your site at 2:00 PM, leaves the tab open while they eat lunch, and comes back to click a link at 3:00 PM, GA4 counts that as two sessions.
There are a few other specific rules regarding session restarts:
Midnight Reset: Unlike the old Universal Analytics, GA4 does not restart a session at midnight. If a user is active from 11:55 PM to 12:05 AM, it remains a single session.
Campaign Parameters: While GA4 is smarter about this than the old version, clicking a link with new UTM parameters (like a different ad campaign) can trigger a new session if the previous one had timed out.
Because GA4 relies on an event-based model, it’s strictly looking for those interaction events to keep the timer running. This is a shift from the old hit-based tracking, and it creates the biggest confusion when comparing data to the old Universal Analytics.
The main reason your numbers look different is how GA4 handles traffic sources for active users.
In the old Universal Analytics (UA), if a visitor clicked a new ad campaign link while they were already browsing your site, UA would cut the current session short and force a new one to start immediately.
GA4 is smarter. As long as the user hasn’t timed out (hit that 30-minute mark), GA4 ignores the change in campaign source and keeps the single session running.
Also, GA4 replaced the old logic of ‘Bounce Rate’ with ‘Engagement Rate.’ In UA, a session with no interaction was a bounce. In GA4, a session is considered ‘engaged’ if it lasts 10 seconds or more, includes a conversion, or visits at least two pages.
Here is the quick comparison:
Feature
Universal Analytics (UA)
Google Analytics 4 (GA4)
Tracking Method
Hit-based (Pageviews)
Event-based (User interactions)
Active Campaign Changes
Starts a new session
Continues current session
Bounce Rate
Single-page sessions = Bounce
Replaced by Engagement Rate
Late Hits
Processed next day
Processed when they happen
I’ve noticed that for most sites, session counts in GA4 are slightly lower than they were in UA. That’s usually because GA4 keeps a single session alive, rather than fracturing it into multiple visits just because a campaign parameter changed mid-stream.
The Key Session Metrics You’ll See in GA4
When you open your reports, you’re going to see several metrics that sound similar but measure very different things. Here is your cheat sheet for what Google Analyics metrics actually mean:
Metric
Definition
session_start
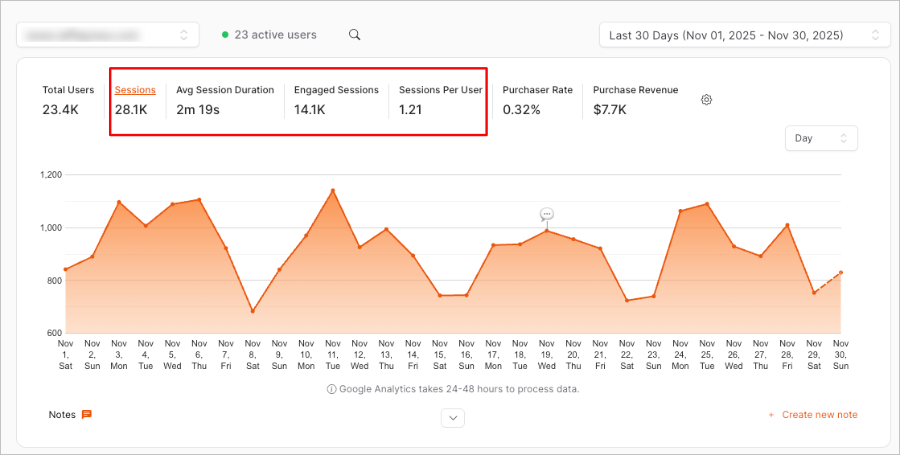
The raw event GA4 fires the moment a new session begins.
Sessions
The total number of visits to your site.
Engaged sessions
The “quality” metric. A session counts as engaged if it lasts 10+ seconds, has 2+ page views, or includes a conversion.
Engagement rate
The percentage of your total sessions that qualified as “engaged.”
Avg. engagement time
Replaces “average session duration.” It tracks the actual time the page was in the foreground of the user’s browser.
Views per session
A measure of how much a user explored your site during a single visit.
Sessions per user
A quick indicator of loyalty. If this number is high, people are coming back.
You should look at these metrics as a story about your user experience. For instance, a high engagement rate means visitors are actually reading what you write.
However, if you see low “views per session,” it usually means your site is hard to navigate. If you are using WordPress, a builder like SeedProd can solve this quickly; it lets you redesign your headers and navigation menus with a drag-and-drop interface, making it easier for visitors to find more content and stay longer.
Where to Find Session Data in GA4
Now that you know what a session is, let’s find the actual numbers in your dashboard.
Log in to your Google Analytics 4 account.
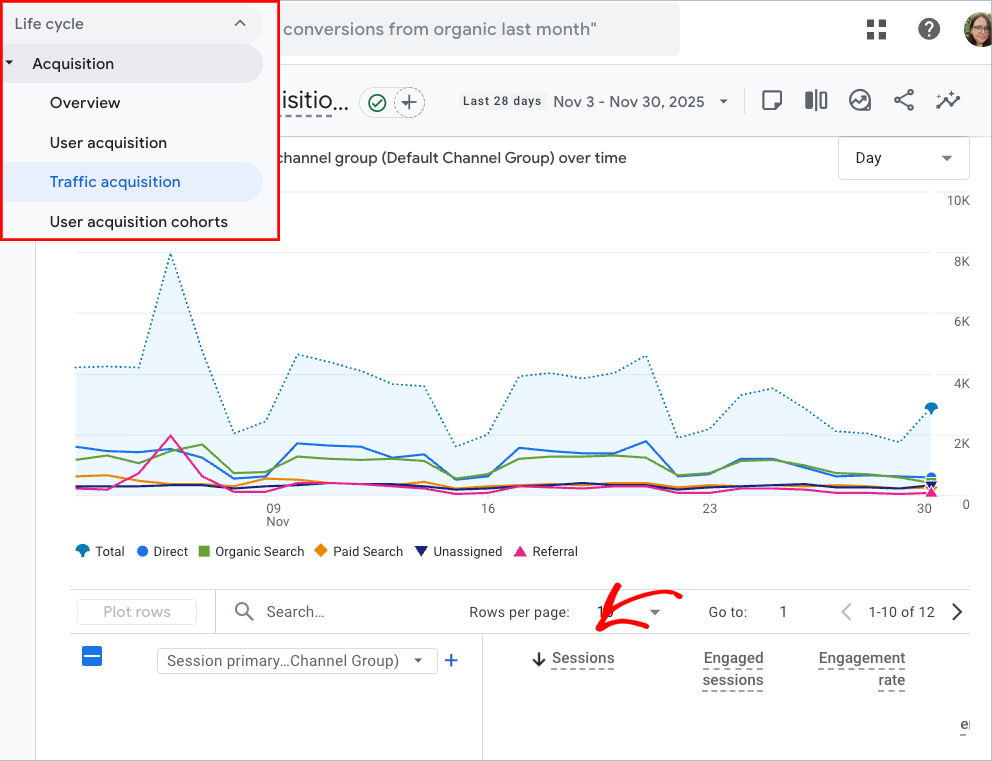
On the left menu, click Reports.
Expand the Acquisition menu and select Traffic acquisition.
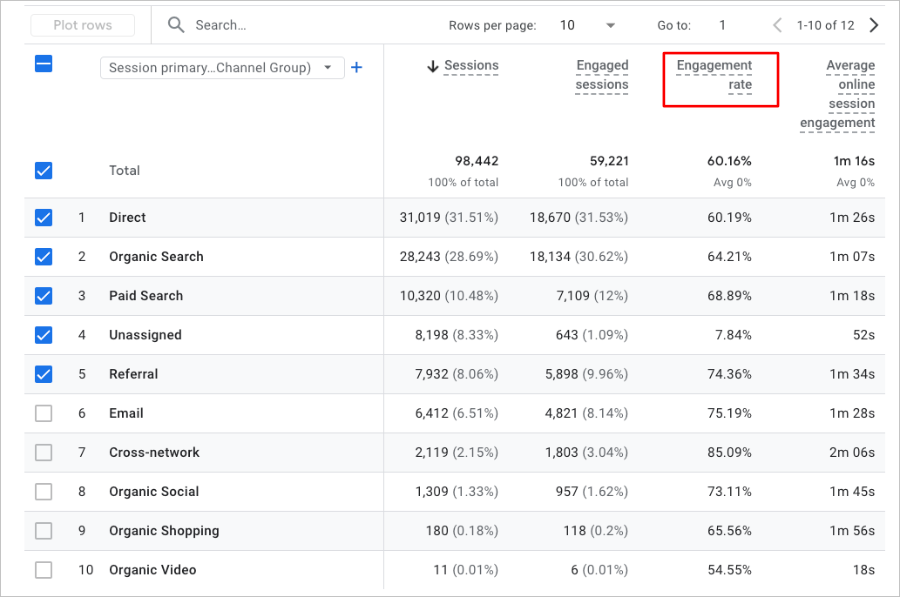
The Traffic acquisition report is your home base. By default, you’ll see the Sessions column sitting right next to Engaged sessions.
This report is essential because it breaks down exactly where your visits are coming from, whether it’s Google Search, your email newsletter, or social media.
Where Is the Rest of GA4 Session Data?
Depending on your screen size, you might have to scroll to the right of the table to find Engagement rate or other key metrics. If you don’t see them, don’t panic. GA4 sometimes hides these columns, or you may need to click the pencil icon to add them to your view.
Do I Need to Use the “Explore” Tab in GA4?
You’ll see a lot of experts recommending the Explore section to build custom session reports. Honestly? Unless you are a data analyst, you can skip that for now.
As of 2025, the standard Traffic acquisition report covers 90% of what you need without the headache.
How to Make Google Analytics Session Reporting Easier
If digging through those GA4 menus feels like a chore, you’re not alone. Most site owners just want to know if their traffic is going up or down without clicking five different buttons every morning.
That’s exactly why we built OnePageGA. It’s a streamlined, Google Analytics dashboard that pulls your essential metrics into a clean, easy-to-read single-page report.
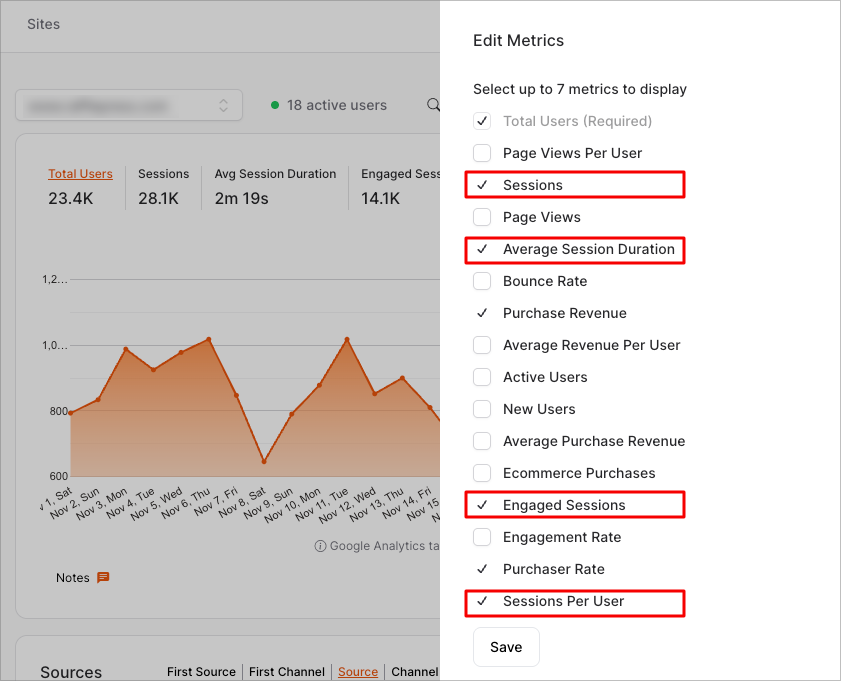
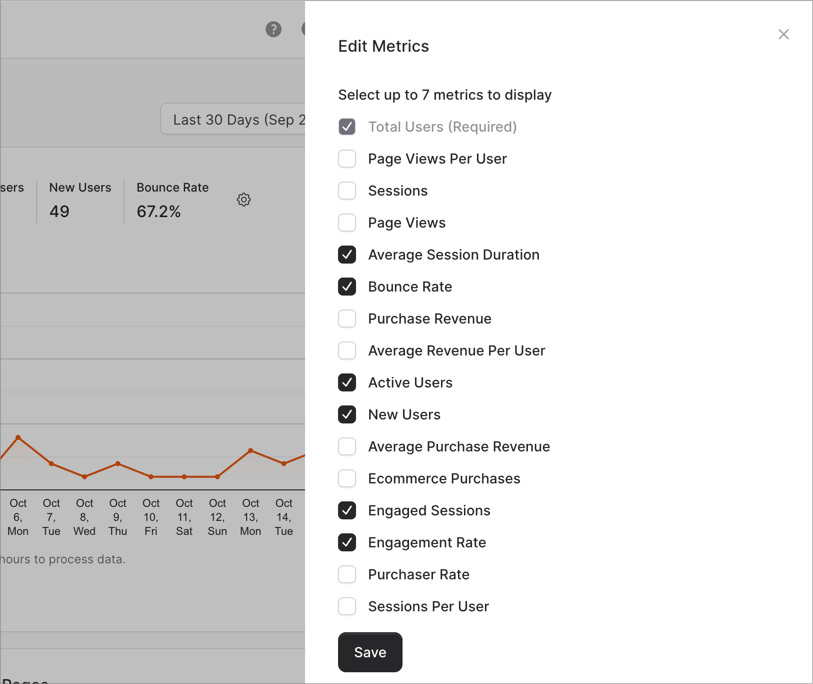
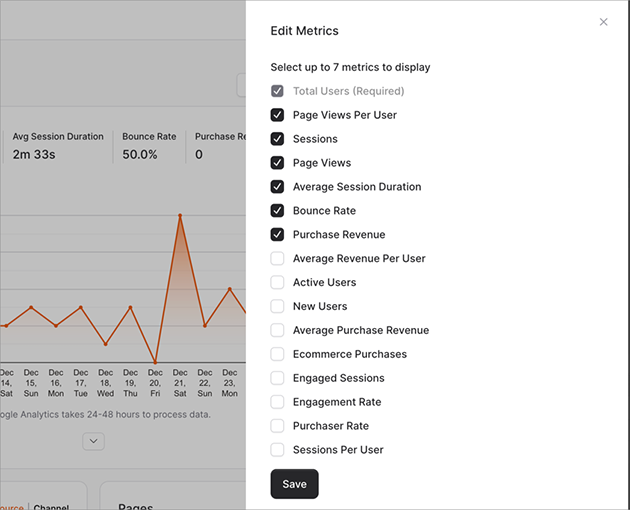
Instead of being stuck with a rigid template, you can make the report your own. Just click the Edit Metrics toggle and select up to 7 metrics that fit your goals.
For a clear picture of your session quality, you can choose:
Sessions
Average session duration
Engaged sessions
Sessions per user
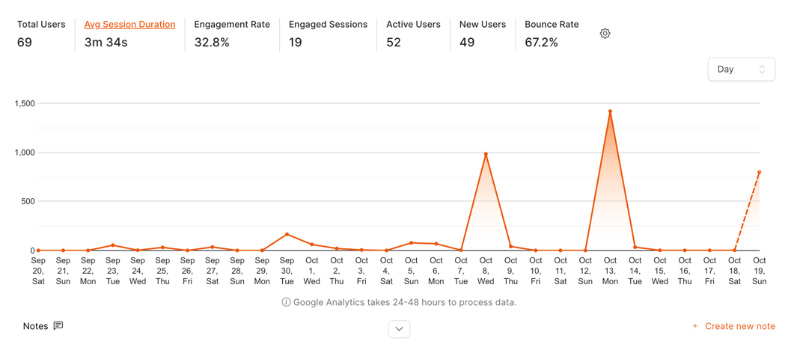
You’ll then see that data at the very top of your analytics report, where you can filter by date range.
Get a Complete View of Your Website Data
Sessions are just the starting point. To really grow your site, you need to know who those visitors are and what they’re doing.
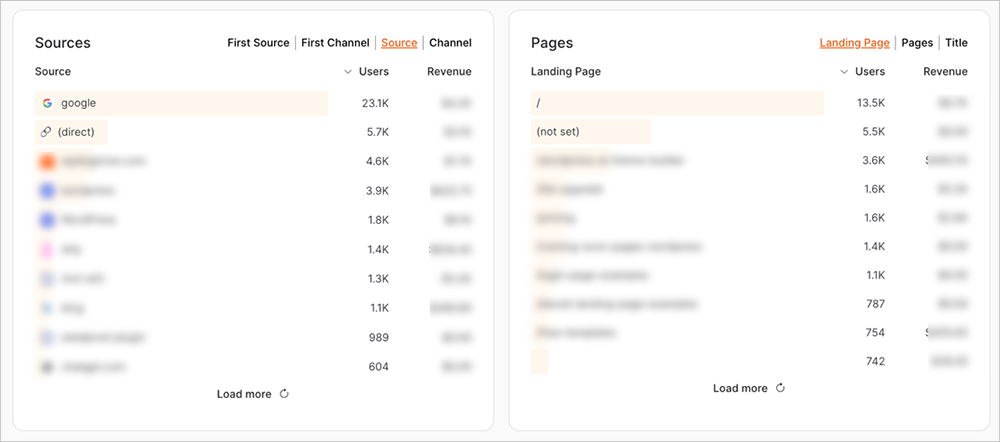
OnePageGA allows you to expand your dashboard to see the full picture. Beyond session metrics, you can track:
Metric
What It Tells You
Top Pages
Finds out which articles or products are grabbing the most attention.
Traffic Sources & UTMs
Shows exactly which marketing campaigns are working.
Locations & Devices
Reveals where your audience is located and how they browse.
Events
Tracks specific clicks, downloads, and other key interactions.
This is the fastest way to keep an eye on your site’s health. You get the power of GA4’s data with the simplicity you actually need.
FAQs About Sessions in Google Analytics
What’s the difference between sessions and users in Google Analytics?
A user represents an individual person (or browser) who visits your site. A session is the visit itself. One user can have multiple sessions. For example, if I visit your site today, leave, and come back tomorrow, GA4 counts that as 1 User and 2 Sessions.
What’s the difference between sessions and events in Google Analytics?
Sessions are the container for all activity, while events are the specific actions within that container. Page views, clicks, and scrolls are all “events” that happen inside a “session.”
How long does a session last in Google Analytics?
By default, a session lasts until the user has been inactive for 30 minutes. You can adjust this timer in your GA4 settings if you run a site where users might read or watch content for longer periods without clicking anything.
Are sessions and visits the same in Google Analytics?
Yes, practically speaking. “Visits” was the terminology used in much older analytics tools. Google Analytics uses the term “Sessions,” but they describe the exact same concept: a period of activity on your site.
What is a good average session duration in Google Analytics?
This varies wildly by industry, but generally, a session duration between 2 to 3 minutes is considered healthy. If yours is under 1 minute, you might need to improve your content or navigation to keep people interested.
Final Thoughts
Understanding sessions is the first step to mastering Google Analytics 4. Once you know that a session is just a container for user activity, the rest of the reports start to make a lot more sense.
Remember, while GA4’s default reports are powerful, they can be overwhelming. If you want a cleaner, faster way to track your sessions and growth, OnePageGA is the tool to use. It strips away the noise and gives you the exact data you need to grow your business.
Google Analytics 4 automatically tracks file downloads for you. When a user clicks a link to a supported file type, GA4 records a file_download event, as long as Enhanced Measurement is active in your settings.
In this guide, I’ll show you how to verify this feature is turned on and exactly where to find the data, so you can see which resources people are downloading on your site.
Why Track File Downloads in Google Analytics
Tracking file downloads shows you which resources your visitors actually use. It helps you decide whether your PDFs, eBooks, or templates are worth keeping, improving, or promoting.
In my experience, I’ve seen a single PDF download from a key blog post generate more qualified leads than thousands of pageviews. Download data also helps you understand user intent. If someone downloads a pricing sheet, they’re usually much closer to making a decision.
Note: This guide covers tracking direct clicks on file links. If you place your files behind a WPForms submission form to collect leads, you’ll want to track the form submission as your main conversion goal instead.
How to Track File Downloads with GA4’s Built-in Features
GA4 tracks file downloads automatically when Enhanced Measurement is turned on and the file type is supported. When someone clicks a download link, GA4 fires a file_download event so you can see which files people access.
1. Understand How GA4 Detects File Downloads
GA4 tracks downloads when a link points to a supported file type like PDFs, documents, archives, or media files. It identifies the file by its URL extension and fires a file_download event when someone clicks the link.
File Type
Example
Tracked by Default
PDF
brochure.pdf
✅
DOCX
report.docx
✅
ZIP
assets.zip
✅
EXE
installer.exe
✅
Custom extensions
anything not on Google’s list
✅ Requires a quick settings update
Direct file URLs work best because GA4 detects downloads by checking the end of the link.
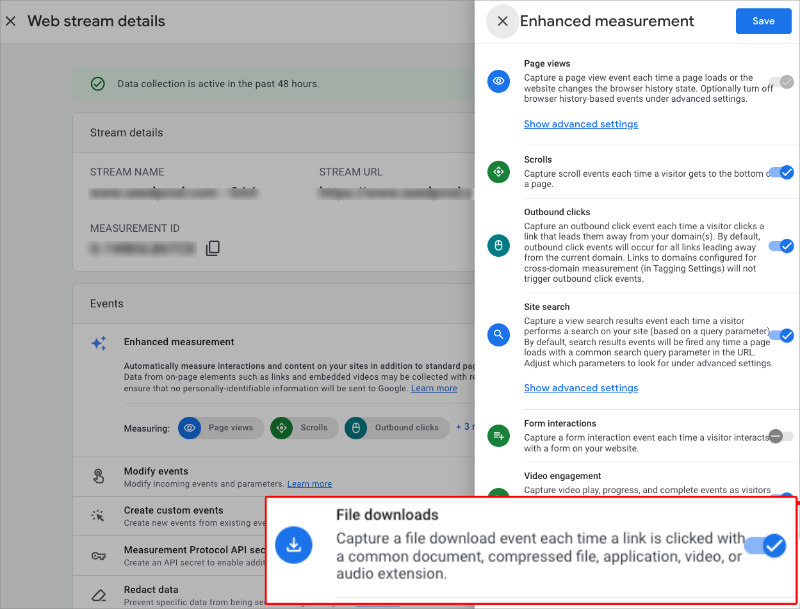
2. Enable Enhanced Measurement for File Downloads
GA4 only tracks file downloads when Enhanced Measurement is turned on. Many sites already have it enabled, but it’s important to check so you know downloads are being recorded.
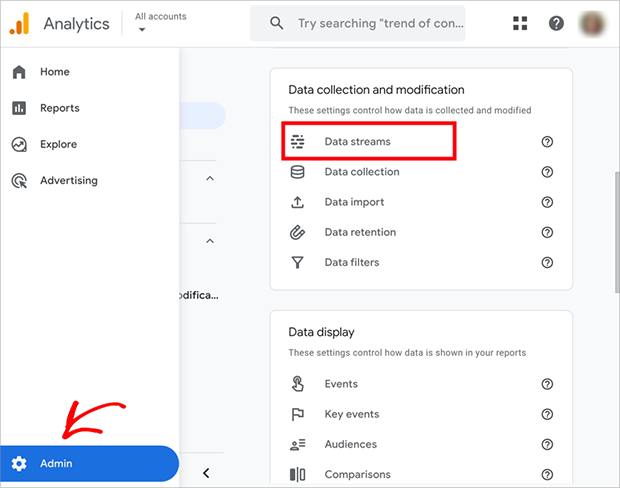
To enable Enhanced Measurement, go to Admin » Data Streams. Select your Web data stream.
Google Analytics 4 data stream settings for tracking file downloads
Turn Enhanced Measurement ON. Then click the gear icon and check that File downloads is enabled.
Enhanced Measurement settings showing file download tracking enabled in GA4
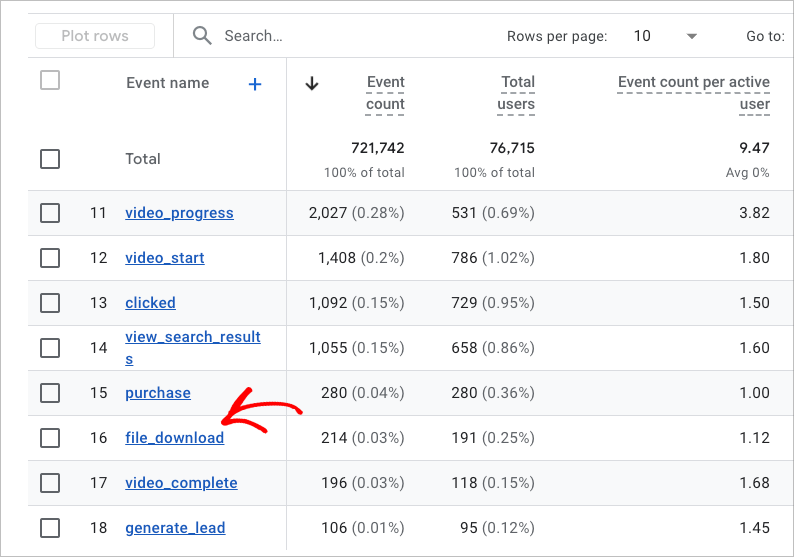
3. Check Download Events in GA4 Reports
You can confirm that GA4 is tracking your file downloads by checking the Events report. This shows each file_download event and the details GA4 collected.
To verify your data, go to Reports » Engagement » Events and look for file_download. Click it to see event details like file_name and link_url.
GA4 file_download event details in the Events report
You can also test this in Realtime or DebugView. Open your site, click a downloadable file, and check that the file_download event appears in GA4.
How to Track File Downloads with OnePageGA (The Easy Way)
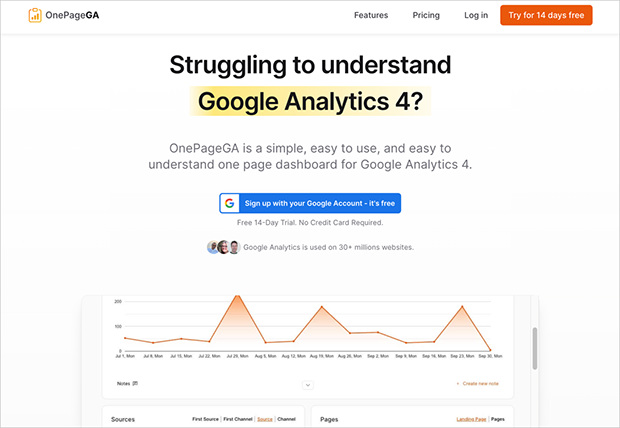
OnePageGA homepage
OnePageGA is a simplified Google Analytics reporting tool that connects to your GA4 property to display key metrics, including file downloads, on a single dashboard. It saves you from having to dig through GA4’s menus or build custom reports just to see your most important data.
1. Connect Your GA4 Property
Connecting OnePageGA to your GA4 account takes less than two minutes. You sign in, choose your property, and your report loads without any setup or configuration.
To get started, go to OnePageGA.com and sign in with your Google account. Select your GA4 property from the list.
Your one-page report appears as soon as the connection is complete.
2. View File Download Data Instantly
Once the report loads, you’ll see your file download data in the Events section. OnePageGA shows the total number of file_download events in a simple, easy-to-read card.
File download event data displayed inside the OnePageGA report
You can view this alongside your traffic, engagement, and conversions, which makes it easier to understand how downloads fit into your overall performance.
Why OnePageGA Simplifies GA4 Reporting
GA4 gives you a lot of data, but finding simple answers takes time. OnePageGA reduces that effort by showing your key metrics, including file downloads, on a single page. You get a clear snapshot without switching between reports or building custom explorations.
Feature
GA4
OnePageGA
Setup Time
10–15 minutes
< 2 minutes
File Download Visibility
Buried under Events
Instantly visible
Setup Required
Yes
No
Ideal For
Data analysts
Small business owners
From my perspective, having all the data in one place allows me to spot trends in file downloads, traffic, and engagement without having to build custom reports in GA4.
FAQs About Tracking File Downloads
What are file downloads in GA4?
File downloads are clicks on links that point to supported file types like PDFs, documents, media files, and archives. GA4 records these clicks as file_download events.
Why can’t I see file downloads in GA4?
You may not see file downloads if Enhanced Measurement is turned off or if the file type isn’t supported. You can check this by going to Admin » Data Streams, selecting your web stream, and reviewing the Enhanced Measurement settings.
Can I track different file types separately in GA4?
Yes. GA4 captures details like file_name, file_extension, and link_url, so you can review each file type in your Events report. For custom or uncommon file types, you just need to add the file extension to your “File downloads” settings in Enhanced Measurement—no custom coding needed!
How long does it take for file download data to appear?
GA4 usually shows download events within a few minutes. You can confirm activity faster by checking Realtime or DebugView.
Do I need custom tagging to track downloads?
Most sites don’t. GA4 tracks common file types automatically. You only need a custom event if your files use non-standard extensions.
GA4 does a great job tracking file downloads automatically, but its reports can be confusing. For most users, I recommend starting with GA4’s built-in tracking to understand which resources your visitors use. If you find yourself getting lost in the menus, then a streamlined tool like OnePageGA is the logical next step.
Google Analytics reporting tools make it easy to turn GA4 data into reports that anyone can understand. Instead of digging through menus or exporting spreadsheets, you can see what’s working at a glance and share insights in minutes.
Since GA4 rolled out, I’ve heard the same frustration from business owners and marketers again and again. It’s powerful but complicated. Finding the data you actually need can feel like solving a puzzle.
That’s why I tested the best Google Analytics reporting tools to find those that simplify GA4, save time, and turn data into clear, actionable insights.
Comparison of Google Analytics Reporting Tools
#
Reporting Tool
Best For
Free Plan
Starting Price
🥇
OnePageGA
Clear, simple GA4 reports
✅
From $9/month
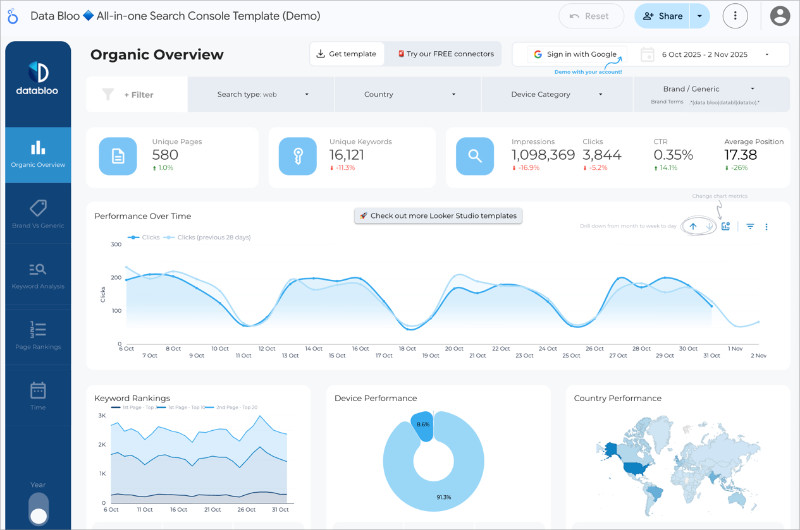
🥈
Looker Studio
Custom dashboards and visuals
✅
Free
🥉
MonsterInsights
WordPress GA4 tracking
✅
From $99.50/year
4
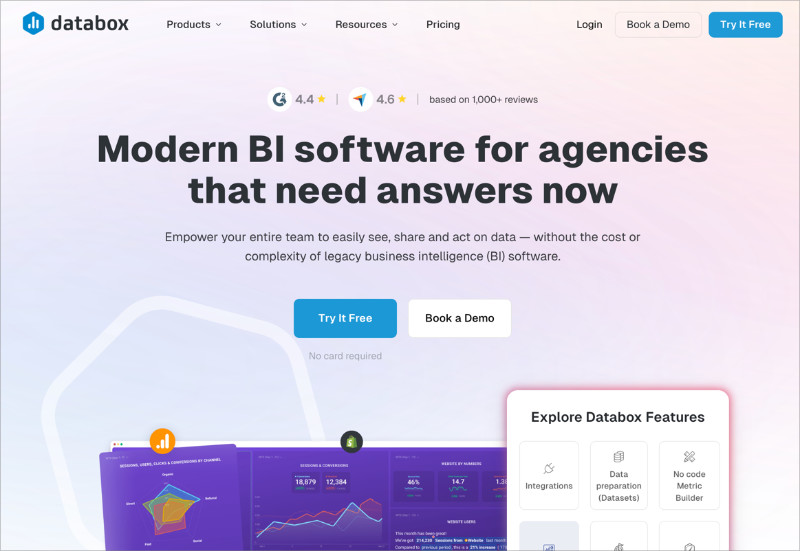
Databox
Multi-source reporting
✅
From $47/month
5
DashThis
Agencies and freelancers
✅
From $39/month
6
Supermetrics
Data analysts and marketers
✅
From $39/month
7
Whatagraph
Team collaboration
✅
From $39/month
8
Raven Tools
SEO + analytics blend
✅
From $39/month
How I Chose These Google Analytics Reporting Tools
When I tested each Google Analytics reporting tool, my goal was simple. I wanted to find out which ones actually make GA4 easier to understand. I connected the same GA4 property to every platform, built sample reports, and noted how long it took to get usable insights I could share with clients.
Here’s what I paid attention to:
Setup speed: How quickly I could connect a GA4 property and see my first report without troubleshooting.
Clarity: Whether the data was displayed in a way that made sense right away, even for someone new to analytics.
Automation: Options to schedule reports, add white-label branding, or share live dashboards automatically.
Integrations: How easily each tool connected with other data sources like Google Ads, Search Console, or social media platforms.
Pricing and scalability: Whether the plans felt fair for individuals, small teams, and agencies managing multiple clients.
The tools that made this list checked all those boxes: fast setup, clear insights, and reports that anyone can understand.
The Top Google Analytics Reporting Tools
I tested dozens of platforms to see which ones make reporting faster and easier. These are the Google Analytics reporting tools that stood out for clarity, automation, and real-world usability.
OnePageGA makes GA4 data simple with one clear, visual report
OnePageGA is a lightweight analytics platform that turns complex GA4 data into one clear, visual report you can understand at a glance. It’s the tool I now use for my own analytics because it saves hours of digging through GA4’s confusing menus.
Pricing: Free plan + Pro from $9/month
Free Plan / Trial: Yes
Standout Features:
🔹 2-minute GA4 setup 🔹 One-page visual reports 🔹 Agency plan for multiple sites
Rating: A+
Best For: Anyone who wants clear, simple GA4 insights
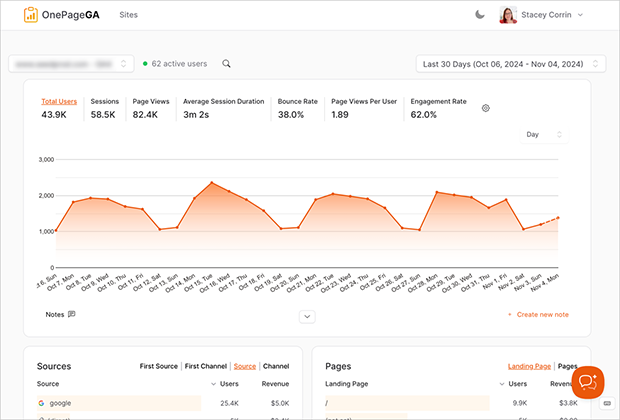
Setup only takes a couple of minutes. I connected my GA4 property, and OnePageGA instantly generated a one-page summary showing traffic, engagement, top pages, and sources. There was no need to build dashboards or apply filters. The report was ready to use right away.
he OnePageGA dashboard gives you a complete GA4 summary in one page.
What I like most is how focused it feels. Instead of drowning you in endless metrics, OnePageGA highlights the data that actually matters. It’s perfect if you just want to open a page, see what’s happening, and move on with your day.
It also works great for managing multiple sites. With an Agency plan, I could view performance across several websites from one account, and team members with GA4 access could see the same reports instantly. It keeps everything simple and consistent for everyone involved.
What I Like About OnePageGA
What I Don’t Like About OnePageGA
Quickest GA4 setup of any reporting tool I tested.
Limited customization for advanced users.
Clean, simple layout that highlights what matters most.
Perfect for clients or teams who just want clarity without complexity.
In my experience, OnePageGA is the simplest way to turn GA4 data into insights you can actually use. It gives you instant clarity without the noise.
Looker Studio lets you design fully customized GA4 dashboards.
Looker Studio (formerly known as Google Data Studio) is Google’s free tool for building fully customizable analytics dashboards. It connects directly to GA4 and gives you complete control over how your data is displayed.
Pricing: Free
Free Plan / Trial: Yes
Standout Features:
🔹 Full GA4 integration 🔹 Custom charts and filters 🔹 Data blending from multiple sources
Rating: A–
Best For: Analysts, marketers, and teams who need full customization
I’ve used Looker Studio to build tailored dashboards for clients who want deep control over their data. Connecting GA4 takes only a few steps, and once the data loads, you can design everything from simple traffic summaries to multi-source performance reports that include Google Ads, Search Console, and even spreadsheet data.
Build visual GA4 reports in Looker Studio.
It’s powerful but not exactly plug-and-play. The first time I used it, I spent a while adjusting metrics, fixing data ranges, and learning how each chart worked. Once you get used to the layout, though, it becomes an incredibly flexible reporting tool that can fit almost any business need.
What I appreciate most is how visual it can be. You can create dynamic dashboards that update automatically and share them via a simple link or PDF. It’s ideal if you manage multiple data sources or need more customization than most plug-and-play tools offer.
What I Like About Looker Studio
What I Don’t Like About Looker Studio
Free to use with full access to GA4 data.
Has a steep learning curve for beginners.
Extremely customizable dashboards and visuals.
Can be time-consuming to set up and maintain.
Supports multiple data sources and live updates.
Performance can slow down with complex dashboards.
Looker Studio is perfect if you want total control over how your GA4 data looks and behaves. It’s not the fastest to set up, but once you master it, it’s one of the most flexible reporting tools available.
MonsterInsights is the easiest way to connect Google Analytics to your WordPress site and view key reports without ever leaving your dashboard. It’s a tool I’ve used for years because it makes GA4 tracking simple for site owners who don’t want to mess with code or complex settings.
Pricing: From $99.50/year (Lite version available)
Free Plan / Trial: Yes (MonsterInsights Lite)
Standout Features:
🔹 One-click GA4 setup in WordPress 🔹 Real-time site stats 🔹 eCommerce and user behavior tracking
Rating: A
Best For: WordPress users, bloggers, and small businesses
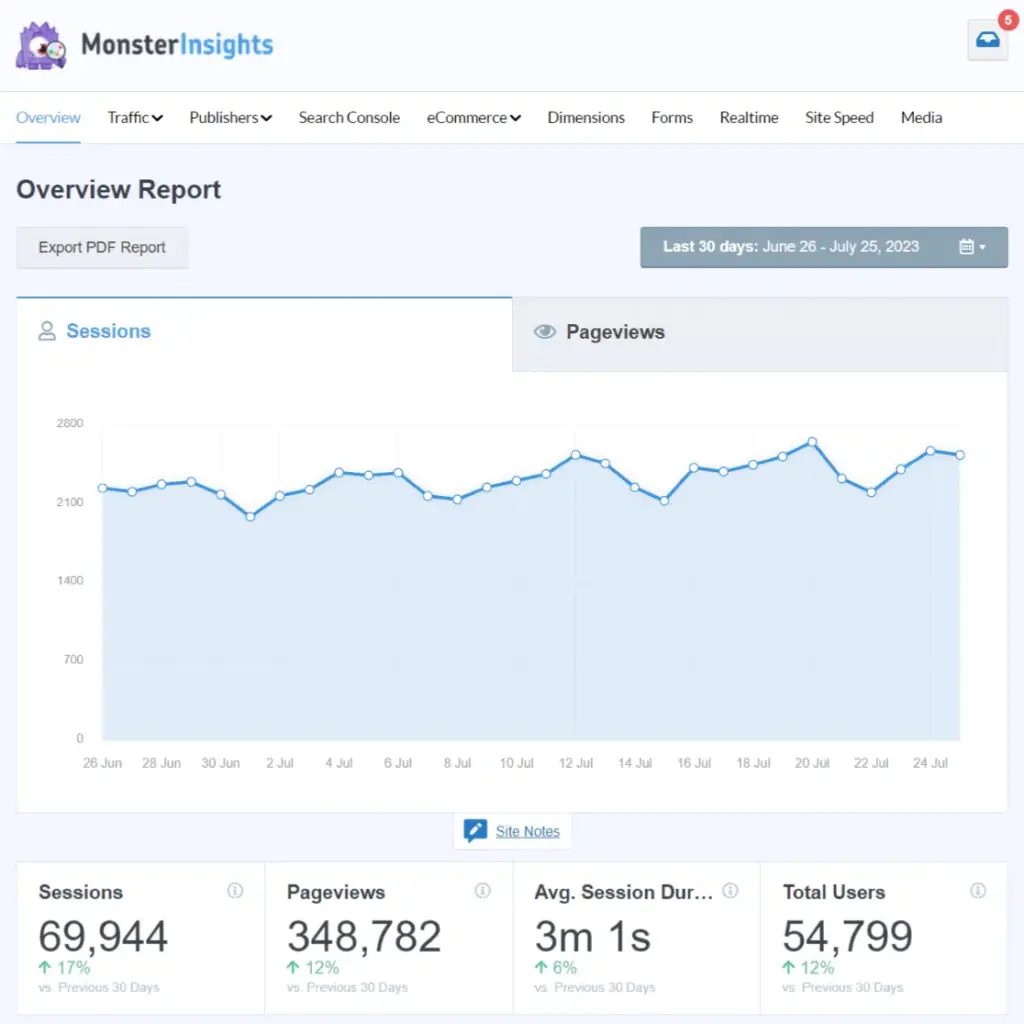
Setting up MonsterInsights takes just a few clicks. I installed the plugin, connected my GA4 property, and immediately started seeing my most important metrics inside the WordPress dashboard. There was no need to switch between tabs or paste tracking codes manually.
The built-in reports are clear and easy to read. I could see traffic, top posts, referral sources, and engagement metrics right from my admin area. For eCommerce sites, it also tracks revenue, conversion rates, and average order values automatically once you enable enhanced eCommerce.
View GA4 reports inside your WordPress dashboard.
It’s the kind of tool that helps you stay informed about how your site is performing without needing to become a GA4 expert. Everything you actually care about is summarized neatly in one place.
What I Like About MonsterInsights
What I Don’t Like About MonsterInsights
Quick setup directly inside WordPress.
Advanced reports require the Pro plan.
Beginner-friendly interface with no coding required.
Accurate GA4 data shown in real time.
If your website runs on WordPress, MonsterInsights is a must-have for GA4 reporting. It brings all your analytics into one familiar place and helps you focus on what matters most: growing your site.
Databox is a powerful reporting platform that pulls all your marketing, sales, and analytics data into one dashboard. It’s ideal if you want to see your GA4 metrics alongside results from tools like Google Ads, HubSpot, or Facebook Ads.
Pricing: From $47/month
Free Plan / Trial: Yes
Standout Features:
🔹 70+ native integrations 🔹 Real-time data sync 🔹 Goal and performance tracking
Rating: A–
Best For: Agencies, marketing teams, and data-driven businesses
When I tested Databox, I connected GA4 and Google Ads within minutes. The platform automatically populated dashboards with my core metrics, saving me from building everything from scratch. I especially liked how you can customize each widget to highlight what’s most important for your team.
One of my favorite features is the ability to track progress toward goals. I set targets for website sessions and conversion rates, and Databox displayed real-time progress bars showing how close I was to reaching them. It’s a great way to stay focused on performance without getting lost in raw data.
While it offers a lot of flexibility, it can take some time to organize the perfect layout if you’re managing several clients or data sources. Once it’s set up, though, everything runs smoothly with automatic updates and shareable reports.
What I Like About Databox
What I Don’t Like About Databox
Connects GA4, SEO, and social analytics in one place.
Initial setup can be time-consuming for complex accounts.
Goal tracking keeps teams aligned on performance.
Advanced features require higher-tier plans.
Automatic updates and easy sharing options.
If you manage multiple channels or clients, Databox gives you everything you need to keep GA4 data and other metrics in sync. It’s perfect for teams that want one central view of performance across all platforms.
DashThis is built for agencies that need to automate and deliver professional GA4 reports to clients. It takes the manual work out of reporting so you can spend more time focusing on campaign strategy and results.
Best For: Marketing agencies and freelancers with recurring clients
When I tested DashThis, I created a full GA4 dashboard in just a few minutes using one of its prebuilt templates. The platform automatically pulled in my key metrics, saving me from having to connect every data point manually. Once the setup was complete, the dashboard refreshed itself automatically with the latest GA4 data.
What stood out most was the automation. I scheduled monthly reports for my test accounts, and DashThis generated and sent them automatically to my inbox with a professional layout and client branding. It’s a huge time-saver for agencies managing multiple clients who expect regular updates.
The dashboards look clean and professional right out of the box, but there’s still room to customize colors, widgets, and layouts. It strikes a nice balance between simplicity and flexibility, which makes it great for teams that want efficiency without sacrificing presentation.
What I Like About DashThis
What I Don’t Like About DashThis
Automated client reporting saves hours every month.
Limited advanced customization for power users.
Polished templates make reports look professional instantly.
Can get expensive as you add more dashboards.
White-label options ideal for agencies and freelancers.
If you manage recurring client reports, DashThis is one of the most efficient ways to automate GA4 reporting and deliver beautiful, consistent dashboards on schedule.
Supermetrics is designed for marketers and analysts who want to dig deep into their GA4 data. Instead of providing a dashboard, it lets you export your analytics data directly into tools like Google Sheets, Excel, or Looker Studio for advanced analysis.
Pricing: From $39/month
Free Plan / Trial: Free trial available
Standout Features:
🔹 GA4 and Google Ads connectors 🔹 Scheduled data refreshes 🔹 Works with Sheets, Excel, and Looker Studio
Rating: A–
Best For: Data analysts and advanced marketers
When I tested Supermetrics, I connected my GA4 property and had my key data pulled into Google Sheets within minutes. I could build my own pivot tables, add filters, and combine data from multiple traffic sources like Facebook Ads and Google Search Console.
The automation features are a major time-saver. I scheduled daily updates so the spreadsheet always contained the latest GA4 metrics without needing to refresh anything manually. This made it easy to create ongoing performance dashboards for clients and internal teams.
It’s not the most visual tool out of the box, but that’s the point. Supermetrics gives you full control over your data so you can analyze it however you want. If you love working in spreadsheets and want the raw data at your fingertips, it’s one of the best options available.
What I Like About Supermetrics
What I Don’t Like About Supermetrics
Pulls GA4 data directly into Sheets, Excel, or Looker Studio.
Requires manual setup for custom reports.
Powerful automation with scheduled data refreshes.
Not ideal for beginners who prefer visuals.
Supports data from multiple platforms for deeper analysis.
If you prefer to analyze your own data or build advanced reporting models, Supermetrics gives you the freedom and precision you need to go beyond basic GA4 dashboards.
Whatagraph is a visual reporting tool built for marketing teams that need to collaborate on GA4 data. It makes it easy to create, customize, and share reports that everyone on your team can understand at a glance.
Pricing: From $39/month
Free Plan / Trial: Free trial available
Standout Features:
🔹 Team dashboards and shared access 🔹 GA4 and multi-platform reporting 🔹 Prebuilt templates for quick setup
Rating: A–
Best For: Marketing teams and agencies
Setting up Whatagraph was simple. I connected GA4, and within minutes, I had a ready-made dashboard showing traffic trends, sources, and engagement. The drag-and-drop widgets made it easy to adjust the layout so my team could focus on the metrics that mattered most.
What stood out to me was the collaborative side. I could invite team members to view or edit reports, and each person saw updates in real time. This made reviewing campaign performance and planning next steps much easier since everyone worked from the same live data.
It also supports multiple integrations beyond GA4, so if your team tracks results across several platforms, you can bring everything together in one place. It’s not as advanced as Looker Studio, but it’s far more approachable for day-to-day collaboration.
What I Like About Whatagraph
What I Don’t Like About Whatagraph
Real-time collaboration with shared dashboards.
Custom visualizations can be limited compared to Looker Studio.
Easy drag-and-drop setup for clear, visual reports.
Pricing can add up for larger teams.
Strong integration support for multi-channel analytics.
If you manage analytics with a team, Whatagraph makes GA4 reporting simple and collaborative. It’s perfect for teams that want visual reports everyone can understand without extra training.
Raven Tools combines SEO insights with GA4 analytics, giving you a complete view of your website’s performance. It’s designed for marketers who want to track keyword rankings, backlinks, and traffic data all in one place.
Pricing: From $39/month
Free Plan / Trial: Free trial available
Standout Features:
🔹 GA4 and SEO integration 🔹 Keyword and backlink tracking 🔹 Automated client reporting
Rating: B+
Best For: Marketers who want combined SEO and analytics reporting
When I tested Raven Tools, I liked how it merged analytics with SEO data in one dashboard. I connected GA4 and instantly saw key traffic metrics next to keyword rankings and backlink stats. This helped me understand not just how much traffic I was getting, but where it was coming from and why.
The automated reports were another highlight. I scheduled weekly summaries that included both SEO and GA4 performance, which saved time compared to pulling the same data from separate tools. The reports were clean, easy to read, and ready to share with clients.
It’s not as polished as tools built specifically for GA4 reporting, but it’s great if you want one platform to monitor both analytics and SEO performance together. It’s especially useful for smaller agencies or freelancers managing multiple sites.
What I Like About Raven Tools
What I Don’t Like About Raven Tools
Combines SEO metrics and GA4 analytics in one place.
Interface feels a bit dated compared to newer tools.
Automated reporting saves time on client updates.
Limited customization options for report design.
Good value for small agencies or freelancers.
If you want to track both your analytics and SEO results together, Raven Tools gives you a straightforward way to see how your content, rankings, and traffic connect from a single dashboard.
Which Google Analytics Reporting Tool Is Best?
After testing all eight tools, OnePageGA stood out as the best overall Google Analytics reporting tool. It delivers exactly what most people need: fast setup, clear reports, and no extra complexity.
Tools like Looker Studio and Supermetrics are great if you need deep customization or prefer building reports from scratch. And platforms such as Databox or DashThis make sense for agencies managing multiple clients or data sources.
But for most users, especially freelancers, small businesses, and teams that just want clarity from GA4, OnePageGA is the clear winner. It turns complicated data into a simple, one-page summary that anyone can understand in minutes.
FAQs About Google Analytics Reporting Tools
What is a Google Analytics reporting tool?
A Google Analytics reporting tool connects to your GA4 account and turns your data into easy-to-read reports. Instead of manually creating charts or filtering metrics, these tools present your traffic, engagement, and conversions in a clear visual format.
Why use a Google Analytics reporting tool instead of GA4 directly?
GA4 is powerful but not always user-friendly. A reporting tool helps you save time by highlighting the key metrics that matter most, without needing to dig through multiple GA4 menus. It simplifies analysis so you can make faster, data-driven decisions.
Which Google Analytics reporting tools are free?
Several tools on this list offer free options, including OnePageGA, Looker Studio, and MonsterInsights Lite. These free versions cover essential GA4 reporting needs and are a great starting point before upgrading for advanced features.
What’s the best Google Analytics reporting tool for agencies?
For agencies, DashThis and Databox are excellent choices because they automate client reporting and offer white-label dashboards. OnePageGA is also ideal for agencies that want clear, shareable reports with minimal setup time.
What’s the best Google Analytics reporting tool for WordPress?
The best tool for WordPress users is MonsterInsights. It integrates directly with your WordPress dashboard so you can view GA4 reports without leaving your site. For those who prefer a standalone reporting view, OnePageGA is a simple alternative that works perfectly alongside any WordPress setup.
If you’re tired of wasting time trying to make sense of GA4, the right reporting tool can change everything. It should make your data simple, clear, and ready to act on, not something you avoid using.
After testing them all, OnePageGA is the tool I keep coming back to. It gives you instant clarity without the clutter, so you can focus on what matters most: growing your business.
Measuring time on page in Google Analytics means tracking how long visitors stay engaged with your content. In GA4, this is now called Average Engagement Time, which measures the moments when users are actively viewing your site.
Since GA4 replaced Universal Analytics, many users have struggled to find this data. It’s still there, just under a new name and buried in different reports.
In this guide, I’ll show you how to find it, understand what it means, and see an easier way to track the same insights with OnePageGA.
What “Time on Page” Means in Google Analytics 4
In GA4, “Time on Page” has been replaced with Average Engagement Time, which measures how long users actively view or interact with your site. It only counts when your page is visible on screen, not when it’s open in a background tab.
This shift gives you a more accurate picture of real engagement instead of just page duration. Here’s how the new metrics compare to the old Universal Analytics terms:
Metric
What It Measures
Where to Find
Replaces (UA Equivalent)
Average engagement time
Active on-screen time
Engagement → Pages and Screens
Time on page
Engagement rate
Percentage of engaged sessions
Engagement overview
Bounce rate
Understanding these differences helps you read GA4 data correctly. Instead of guessing how long people stayed, you can now see when they were truly engaged.
How to Measure Time on Page in GA4
To measure time on page in GA4, open your property and go to Reports » Engagement » Pages and Screens.
In this report, look for the column labeled Average engagement time. This shows how long visitors are actively engaging with each page while it’s visible on screen.
Average Engagement Time in GA4.
By default, the table displays Page path and screen class, which lists your page URLs. If you’d rather view page titles, click the dropdown above the table and choose Page title and screen class.
Switch between page titles and URLs.
You can also click the “+” icon beside the dimension name to add a secondary dimension. A useful example is Device category, which lets you compare engagement time across mobile, tablet, and desktop users. This helps you see if visitors on one device type spend less time on your pages than others, which could indicate layout or speed issues.
Compare engagement by device type.
This setup gives you a complete view of how users engage with your content and which pages or devices drive the most attention.
How to Measure Time on Page in OnePageGA
If GA4 feels overwhelming, OnePageGA makes measuring time on page simple. It connects directly to your GA4 property and displays your key engagement metrics, including session duration and engagement rate, all in one clear dashboard.
OnePageGA dashboard overview.
OnePageGA is designed for marketers, founders, and small teams who want fast, visual insights without digging through complex GA4 reports. Setup takes less than two minutes, and once connected, you can choose up to seven metrics to track, such as Average Session Duration, Page Views per User, and Engagement Rate.
Unlike GA4, OnePageGA also includes familiar metrics from Universal Analytics, such as Bounce Rate and Average Session Duration. These make it easier to interpret GA4’s engagement data using terms you already recognize.
Here are some of the metrics you can view in OnePageGA:
Metric
What It Means
Page Views per User
Average number of pages each visitor views during their session
Sessions
Total number of visits to your website
Page Views
Total times pages are viewed across all sessions
Average Session Duration
Average amount of time users stay active during a session
Bounce Rate
Percentage of sessions with no engagement beyond the first page
Purchase Revenue
Total revenue generated from transactions
Ecommerce Purchases
Number of completed purchases on your site
Engaged Sessions
Sessions lasting at least 10 seconds or involving interaction
Engagement Rate
Percentage of sessions that qualify as engaged
To display these metrics in your OnePageGA report, go to your connected dashboard and click Edit Metrics.
Choose metrics to display.
Choose up to seven from the list, then click Save to update your view. You can then click each metric to instantly see the data in a simple, one-page layout.
View engagement, session duration, and more.
With OnePageGA, you can skip the complex tables and custom explorations. You get a clear snapshot of how long visitors stay, how engaged they are, and which pages perform best, all on one simple page.
How to Interpret Time-on-Page Metrics in GA4
Understanding your engagement time helps you see how well your content holds attention. GA4’s Average Engagement Time shows how long users actively view or interact with a page, giving you insight into what keeps them interested.
What counts as a “good” engagement time depends on the type of page. For example, a Contact page might only need a few seconds of engagement if users quickly find your phone number or form, while a blog post should naturally keep visitors for a minute or more.
Use this table to interpret your data and decide what to do next:
Scenario
Engagement Time
What It Suggests
Optimization Action
Under 15 seconds
Very low
Visitors leave quickly without interacting
Improve load speed, simplify layout, or refine intro content
30–60 seconds
Average
Typical engagement for blog or product pages
Add visuals, CTAs, or internal links to encourage longer visits
90 seconds or more
Excellent
Visitors are highly engaged
Repurpose or promote similar content for more traffic
Tracking these trends over time helps you spot what works and what needs improvement. If you want to see these engagement insights faster, OnePageGA brings them together in a single, visual report.
FAQs About Measuring Time on Page in GA4
Why can’t I find “Average Time on Page” in GA4?
GA4 no longer uses “Average Time on Page.” It’s been replaced by Average Engagement Time, which only measures the time users actively spend viewing or interacting with your content.
How is engagement time calculated in GA4?
GA4 tracks engagement time whenever your webpage is in an active browser tab. If someone switches tabs or minimizes the window, the timer pauses, giving you a more accurate measure of real attention.
Does GA4 still track bounce rate?
Yes, but it’s calculated differently. GA4’s Bounce Rate now measures the percentage of sessions that were not engaged, meaning users didn’t stay at least 10 seconds or trigger an event.
What’s the difference between Engagement Time and Session Duration?
Engagement Time measures how long users were active on screen, while Session Duration includes total time from when a session starts until it ends. Engagement Time is more reliable for judging true attention.
See Your Engagement Time Clearly
GA4 makes it possible to track how long visitors stay active on your pages, but finding and interpreting that data can take time. Tools like OnePageGA simplify the process by showing your engagement metrics in a single, easy-to-read view.
You can’t import full Universal Analytics (UA) data into Google Analytics 4 (GA4). That might sound worrying, but you’re not completely out of options.
GA4 doesn’t accept direct historical imports because its entire tracking model is different. However, there are still ways to bring in specific types of data and safely preserve your old reports for future reference.
In this guide, I’ll walk you through what you can import, why GA4 doesn’t accept full UA history, and the best methods I use to keep my historical analytics data accessible for long-term reporting.
What Data Can You Actually Import into GA4?
You can’t move everything from Universal Analytics into GA4, but you can import certain data types that help fill in the gaps. These imports are especially useful if part of your customer journey happens outside your website.
Offline Conversion Data
Offline conversions are actions that happen away from your website, like phone orders, in-store purchases, or leads collected in your CRM. GA4 lets you import this information so it connects back to what those users did online.
To do this, you’ll need to upload your offline conversions as event data. Each event should include a matching User-ID or Client-ID so GA4 can link it to the right person or session. Use Client-ID for anonymous visitors and User-ID for logged-in users or returning customers.
If you also collect information such as an email address, use it in your own records to find the correct identifier before uploading.
This approach works best for businesses that collect leads or sales through multiple channels. For example, if someone fills out a form on your site and later completes their purchase over the phone, you can record both actions as part of the same customer journey.
how offline conversions connect to online user activity in GA4
Limited Ecommerce Data
You can also import enhanced ecommerce data into GA4, but there are limits. Universal Analytics tracked product views and cart adds as separate hit types, while GA4 treats them as events with parameters.
That means you can move structured sales information such as product IDs, categories, and order values, but not every old metric has a direct match.
For most site owners, this type of import is helpful only if you depend on revenue tracking for long-term reports or want to double-check that your new GA4 ecommerce setup is accurate.
Why You Can’t Import UA History into GA4
You can’t import your old Universal Analytics history into GA4 because the two platforms store and measure data in completely different ways. They may look similar on the surface, but the data underneath isn’t compatible.
Here’s a simple comparison:
Feature
Universal Analytics (UA)
Google Analytics 4 (GA4)
Core Model
Session-based
Event-based
Data Types
Hits (pageviews, events, transactions)
Events with parameters
Tracking IDs
Client ID & User ID
Blended identity (User ID, Google signals, device ID)
Reporting
Fixed reports
Custom reports with Explorations
Goals
Destination, duration, event, pages/screens per session
Custom events and conversions
Think of it like trying to pour water from a square container into a round one. The shapes don’t align, so some of the data simply won’t fit.
GA4’s system is designed to collect richer, more flexible data, but that also means your older session-based records can’t be reprocessed in the same way.
4 Ways to Preserve and Access Your Historical Data
Now that Google has fully sunset Universal Analytics as of July 1, 2024, your old data doesn’t have to be lost. If you exported or backed up your reports before access ended, there are still several ways to store, view, and compare that information alongside your GA4 results.
Below are four practical methods you can use to keep your historical insights accessible today.
1. Export Key Reports from Universal Analytics
If you downloaded reports before Universal Analytics shut down, those files are now your best source of historical data.
Start by organizing your saved exports in one place, such as Google Drive or Dropbox. Then, focus on reports that give you meaningful long-term insights, such as:
Audience Overview for total users and sessions
Acquisition → All Traffic for traffic sources
Behavior → Site Content for top pages and engagement
Conversions → Goals or Ecommerce for leads and sales
If you missed the export window, check your inbox for any scheduled email reports or dashboards saved as PDFs. These can still help you benchmark performance against your GA4 data.
2. Connect Universal Analytics to BigQuery (Free Option)
If you linked Universal Analytics to BigQuery before the sunset, you already have one of the most reliable long-term backups available.
BigQuery is Google’s cloud-based data warehouse that stores your analytics data in full detail. It lets you run custom queries or connect the data to reporting tools like Looker Studio.
Use the Create dataset button in BigQuery to add a GA4 dataset next to your UA exports.
Here’s what to do next:
Open your BigQuery project and confirm your exported UA tables are still available.
Check your data retention settings to make sure nothing is set to expire automatically.
Create a new dataset for your GA4 exports so you can view both data sets side by side.
Use Looker Studio to build reports that show year-over-year changes.
BigQuery is ideal if you have a large website or need complete access to past data for audits and long-term trend analysis. It includes a free monthly quota for both storage and queries, but costs can apply if you exceed those limits.
Always monitor your usage to stay within your free tier. The allowance is generous, and most small business sites will never hit the limit.
3. Use Looker Studio Dashboards
If you exported data or connected it to BigQuery before Universal Analytics was sunset, you can still visualize that information in Looker Studio. It lets you combine your old UA data with your new GA4 property for side-by-side comparisons.
To do this, upload your saved UA data as a CSV or Google Sheet, then add GA4 as a separate data source.
How UA and GA4 datasets can be connected side by side in Looker Studio.
From there, you can create charts showing how traffic, engagement, and conversions have changed over time.
If building dashboards in Looker Studio feels overwhelming, OnePageGA can help with the GA4 side of your analysis.
OnePageGA makes it easy to view GA4 reports without building custom dashboards.
It doesn’t import UA data, but it simplifies your current GA4 reporting with ready-made dashboards for WordPress sites. That way, you can quickly understand your new metrics without getting lost in GA4’s complex interface.
4. Create a Manual Data Log
If you never exported your Universal Analytics data before the sunset, a manual record is the next best fallback. It won’t give you exact numbers, but it helps preserve useful benchmarks for long-term reference.
Start by checking any screenshots, old reports, or email summaries you might have saved. Record key metrics such as total sessions, top pages, and conversions in a simple spreadsheet.
Here’s an example format you can use:
Date Range
Users
Sessions
Top Page
Conversions
Notes
Jan 1, 2022 – Jan 31, 2022
10,500
12,200
/blog/best-hosting/
52
From old monthly report PDF
This type of log can’t replace your full analytics data, but it gives you enough context to track growth over time. Even rough historical numbers are better than losing your performance record completely.
How to Compare Old and New Data
Comparing Universal Analytics and GA4 can feel tricky at first, but it’s clearer once you understand how each platform measures activity. The goal isn’t to make the numbers match exactly, but to recognize how GA4 interprets user behavior differently.
Run a Parallel Tracking Period
If you had both properties active before the Universal Analytics sunset, look at overlapping date ranges to understand how your results differ. You’ll likely see changes in users, sessions, and bounce rates because GA4 calculates engagement in new ways.
These differences don’t mean your data is wrong. GA4 uses an event-driven model, while UA relied on sessions and hits. Use that overlap period as your baseline when reviewing future trends.
Here’s a quick guide to help you interpret your data more accurately:
Metric in UA
Closest Equivalent in GA4
Notes
Users
Active Users
GA4 counts users who have an engaged session or are new users. Because of this definition change, user totals are often lower than in UA.
Sessions
Sessions
GA4 sessions don’t restart at midnight or with new campaign sources.
Bounce Rate
Engagement Rate
GA4 flips this into a positive measure of user activity.
Pageviews
Views
Combines data from both web and app properties.
Goals
Conversions
Custom events now define what counts as a conversion.
If you used custom events or goals in UA, you can recreate most of them in GA4 by defining events and marking them as conversions.
Frequently Asked Questions
Can I use both Universal Analytics and GA4 at the same time?
No. Google fully sunset Universal Analytics on July 1, 2024, and all standard properties stopped processing data after that date. You can still use GA4 as your single active property for tracking going forward.
How far back can I export my Universal Analytics data?
You could export all available historical reports before the shutdown, covering the full lifetime of your UA property. If you downloaded CSV or PDF versions, those files remain valid and can still be used for comparisons in Looker Studio or spreadsheets.
Will my historical SEO data be lost forever?
Your Universal Analytics data is no longer accessible within Google’s interface, but it isn’t “gone” if you exported or backed it up. You can combine your past exports with GA4 or Google Search Console data to continue tracking long-term SEO performance.
Is there any way to see old UA data inside GA4?
No. GA4 can’t display or merge your previous UA data. You can only view historical reports from exported files, BigQuery backups, or dashboards you created before the sunset.
In my experience, the biggest mistake people made during the GA4 switch was not saving their old Universal Analytics data in time. If you backed up your reports, you can still use them for comparisons and long-term insights.
Now the focus should be on learning GA4 and keeping your new data organized, so you don’t run into the same problem again later.
To help with that, take a look at these GA4 guides:
OnePageGA vs Google Analytics 4 (GA4): Which Should You Use?
Posted on -
Written By:
Stacey Corrin
Contents
Google Analytics 4 (GA4) is a free tool from Google that tracks how people use your website. It’s powerful, but many business owners find it complicated and time-consuming.
OnePageGA makes things easier. It connects to GA4 and turns the data into a simple dashboard that highlights the numbers you actually need to grow.
In this guide, I’ll compare OnePageGA vs Google Analytics 4 so you can decide if GA4 on its own is enough, or if using it with OnePageGA is the better choice for your business.
How I Compared OnePageGA vs GA4
To make this a fair comparison, I looked at the areas that matter most when choosing an analytics tool:
Ease of setup and learning curve: How easy is it to set up and start using? Do you need technical skills?
Reporting and dashboards: Are the reports clear and simple to understand? Can you find data quickly?
Focus on business metrics: Does it highlight the numbers that matter most, like conversions and top pages?
Customization and flexibility: Can you adjust the dashboards and reports to fit your goals?
Integrations and workflow: Does it connect with other tools and fit smoothly into daily use?
Pricing and support: How much does it cost, and what kind of help is available if you get stuck?
These criteria give a clear framework for comparing GA4 and OnePageGA side by side, so you can see which tool better fits your needs.
What is Google Analytics 4?
Sign up for Google Analytics 4 on the official Google platform.
GA4 is Google’s latest tool for tracking what people do on your website. It replaced Universal Analytics and is now the standard way to collect website data.
GA4 tracks actions, called events, instead of only counting page views. An event can be anything a visitor does, like clicking a button, scrolling a page, or making a purchase. This makes it easier to see the full customer journey.
GA4 is free and very flexible, but it also has a steep learning curve and can feel confusing to new users.
What is OnePageGA?
The OnePageGA homepage, where you can connect GA4 and view your dashboard.
OnePageGA is a web-based tool that works with GA4 to make your data easier to understand. Instead of showing dozens of menus and complex reports, it puts the most important numbers into one clear dashboard.
The setup is quick, and you don’t need technical skills to use it. Once connected, you can see key business metrics like conversions, top content, and referral traffic in one place.
Key features include:
A simple dashboard that’s easy to read
Focus on business goals instead of every possible metric
Fast setup with no coding required
OnePageGA doesn’t replace GA4. You still need GA4 to collect the data. But OnePageGA saves you time by turning that data into insights you can act on right away.
GA4 vs OnePageGA: Feature Comparison
Now that you know what each tool does, let’s compare them side by side. I’ll break down how GA4 and OnePageGA stack up in the areas that matter most for business owners.
Ease of Setup & Use
GA4 can be tricky to get started with. You need to create a property, add tracking code to your site, and often set up Google Tag Manager if you want to track specific events.
GA4 requires setting up a data stream before you can start tracking data
It’s flexible, but for most small business owners the process feels technical and time-consuming.
If you do want to give it a try, I’ve written a full guide on how to add GA4 to your website that walks you through the steps.
OnePageGA, on the other hand, is built for speed. You simply connect it to your GA4 account, pick your website, and your dashboard is ready. No coding, no tags, no long setup process.
OnePageGA connects to GA4 in minutes with no coding required.
In my experience, GA4 is better suited for analysts who enjoy digging into setup, while OnePageGA is the clear winner if you just want to get insights right away.
Dashboards & Reporting
One of GA4’s strengths is that it can show almost any report you can imagine. The problem is you often have to build those reports yourself, and the default views don’t always highlight the numbers a business owner cares about.
GA4 includes detailed traffic reports, but many require customization.
With OnePageGA, reporting is ready from day one. Instead of digging through menus, you see your most important numbers in a single view. It focuses on clarity rather than showing everything at once.
OnePageGA shows your top metrics in a clean, easy-to-read dashboard.
If you enjoy customizing reports and exploring data in depth, GA4 gives you endless flexibility. But if you’d rather skip the setup and get clear answers fast, OnePageGA makes reporting simple and practical.
GA4 tracks almost everything that happens on your site, from page views to scrolls to custom events. That level of detail is powerful, but it also makes it easy to get lost in the data.
GA4 tracks detailed events like clicks, scrolls, and purchases.
OnePageGA narrows the focus. Instead of showing every possible number, it highlights the key growth metrics that tie directly to your goals. This makes it easy to see what is working without wasting time digging through reports.
OnePageGA highlights the key growth metrics that matter most to your business.
In short, GA4 is best if you want complete flexibility, while OnePageGA is built for clarity and speed.
Customization & Flexibility
GA4 gives you almost unlimited ways to customize your reports. You can build dashboards from scratch, apply filters, and even design advanced funnels that track every step of a customer journey.
GA4 lets you build fully custom reports, but it takes time to master.
This flexibility is great if you know what you are doing, but it takes time to master.
OnePageGA offers light customization that stays simple. You can choose which metrics to show, reorder sections, adjust date ranges, and apply basic filters.
OnePageGA allows simple customizations like filters and date ranges.
You can also tailor the dashboard to your goals without touching code.
If you need full control and do not mind the work, GA4 is the better fit. If you want quick adjustments with a clean, focused view, OnePageGA keeps things simple.
Integrations & Workflow
GA4 fits naturally into the Google ecosystem. It integrates with Google Ads, BigQuery, and Looker Studio, making it a strong choice if you already rely on those tools.
GA4 integrates with BigQuery and other Google tools for advanced workflows.
The workflow, however, can feel heavy. You often need to jump between platforms to pull insights together.
OnePageGA keeps things simple. It connects directly to your GA4 account and pulls the most useful data into one dashboard. While it doesn’t replace advanced integrations like BigQuery, it makes day-to-day analytics easier for business owners and marketers.
Pricing
GA4 is completely free to use, which makes it appealing for anyone who wants to track site data without extra cost. The trade-off is the time you spend learning how to use it.
OnePageGA offers a 14-day free trial with no credit card required. After that, pricing depends on the plan:
Personal: $10/month – best for individual site owners
Business: $99/month – designed for ecommerce and marketing teams
Agency: from $20/month per site – made for agencies managing multiple websites
OnePageGA offers Personal, Business, and Agency pricing plans with a 14-day free trial.
The real value comes from the time saved. Instead of digging through GA4, OnePageGA gives you a clear view of the numbers that matter most.
When to Use GA4 Alone vs With OnePageGA
GA4 is the right choice if you have the time and skills to dive into complex reports. It works well for data analysts, larger teams, or enterprises that need complete control and advanced integrations.
For small business owners, solo creators, and marketers, GA4 alone can feel like too much. This is where OnePageGA shines. By connecting it to your GA4 account, you get the clarity you need without the steep learning curve.
Here are a few examples:
A blogger who wants to see which posts bring in the most traffic and signups will get faster answers with OnePageGA.
An ecommerce shop can track top products and referral sales without building custom GA4 reports.
A marketing agency can roll out OnePageGA across client sites to give business owners easy-to-read dashboards while still using GA4 for deeper analysis.
In short, GA4 works well on its own for technical users. But pairing it with OnePageGA makes analytics practical for everyday business use.
Pros & Cons
Every tool has its strengths and weaknesses. Here’s how GA4 and OnePageGA compare at a glance.
Tool
Pros
Cons
Google Analytics 4
– Free to use with no limits – Highly flexible with custom reports and funnels – Strong integrations with other Google tools
– Steep learning curve – Setup takes time
OnePageGA
– Simple dashboard that’s easy to read – Focused on business metrics that drive growth – Quick setup with no coding required – 14-day free trial
– Paid subscription after trial ends – Less advanced customization than GA4 – Works only alongside GA4
GA4 can be enough if you have the time to learn it. But most small business owners find it too complex and prefer a tool like OnePageGA for clarity.
Does OnePageGA replace GA4?
No. GA4 collects the data, and OnePageGA organizes it into an easy-to-read dashboard. You need both to make it work.
Can I use OnePageGA without GA4?
No. OnePageGA connects to GA4, so you need a GA4 property set up first.
Which is better for beginners: GA4 or OnePageGA?
OnePageGA is better for beginners because it is simple to use. GA4 is better for advanced users who want full control.
How much does OnePageGA cost compared to GA4?
GA4 is free. OnePageGA has a 14-day free trial, then paid plans starting at $10 per month.
GA4 is powerful but overwhelming for most business owners. OnePageGA makes it practical by turning complex reports into a clear view of the numbers that matter.
If you want quick insights without the hassle, try OnePageGA free for 14 days and see the difference for yourself.